
Global Indices

Currencies, Crypto & Commodities

SA Indices

SA Upcoming Indicators & Dividends

Global Equity
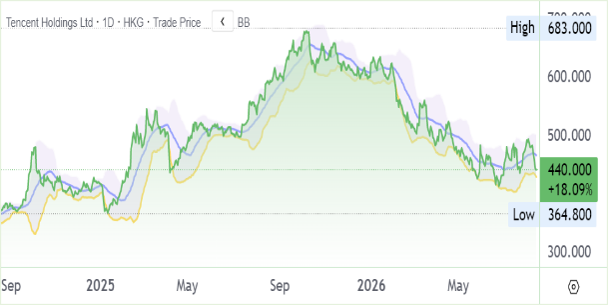
Tencent (0700.HK) Q2 Results for 3M Jun ’26 (440,2 RMB)
Revenue: RMB161.4bn (+11% YoY, vs +9% in 1Q26)
Gross Profit: RMB86.1bn (+13% YoY)
Non‑IFRS Operating Profit: RMB86.1bn (+19% YoY ex‑AI products; 42% margin, +6% vs consensus)
Capex: RMB52.8bn (+176% YoY, +65% QoQ; 1H26 spend RMB84.7bn > FY25 total)
Free Cash Flow: –RMB13.8bn (ex-prepayments RMB37.6bn)
Domestic Games accelerated to +17% growth, aided by Spring Festival timing and new titles. Marketing Services grew +22%, supported by AI‑enhanced targeting and Weixin’s closed‑loop ecosystem. AI investment remains the central debate: spending more than doubled, driving negative FCF and net cash decline. Advertising and cloud show clear AI monetisation, but new AI products (WorkBuddy, CodeBuddy, Xiaowei) remain loss‑making with widening operating drag.
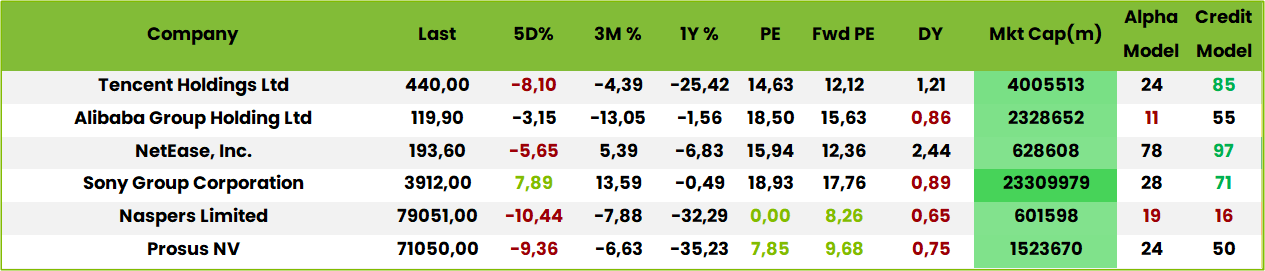
Comment: Core execution is strong, with revenue and profit ahead of consensus, but investor focus has shifted to the scale and payback of AI spend. Tencent trades at c.12x forward P/E, with a 12% 3‑year earnings CAGR, yet rerating likely requires evidence of AI monetisation without weakening cash conversion.
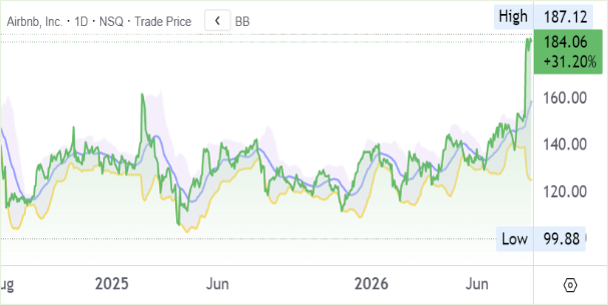
Airbnb* (ABNB) Financial Results for Q2 Jun ’26 (184.98USc)
Revenue: USD 3.6bn (+17% YoY)
EBITDA: USD 1.3bn (+100bp margin YoY, 35%)
Revenue rose 17% YoY to USD 3.6bn, gross booking value grew 16% to USD 27.2bn, and net income reached USD 816m. Adjusted EBITDA came in at USD 1.3bn with a 35% margin, while trailing twelve‑month free cash flow hit USD 4.8bn (37% margin). Nights and seats booked grew 10%, ADR increased 5%, and app bookings surged 23% to 64% of total. Experiences supply expanded 80% YoY, and AI efficiencies reduced customer support costs per booking by 16%. CEO Brian Chesky described AI as “the best thing to ever happen to Airbnb,” highlighting accelerated product launches and pricing tools as growth levers. Management raised FY26 guidance to at least mid‑teens revenue growth and an adjusted EBITDA margin of 35.5%, with limited impact on the business from the Middle East conflict.
Comment: Airbnb’s growth depends on its AI‑driven personalisation, which enhances guest matching and expands monetisation opportunities, alongside hotel partnerships that diversify revenue streams. Strong brand equity, resilient demand for alternative stays, and operational leverage underpin growth. Conclusion: Airbnb is positioned to capture secular travel trends, broaden its ecosystem, and sustain margin expansion despite cyclical pressures.


*holding in a Finova portfolio
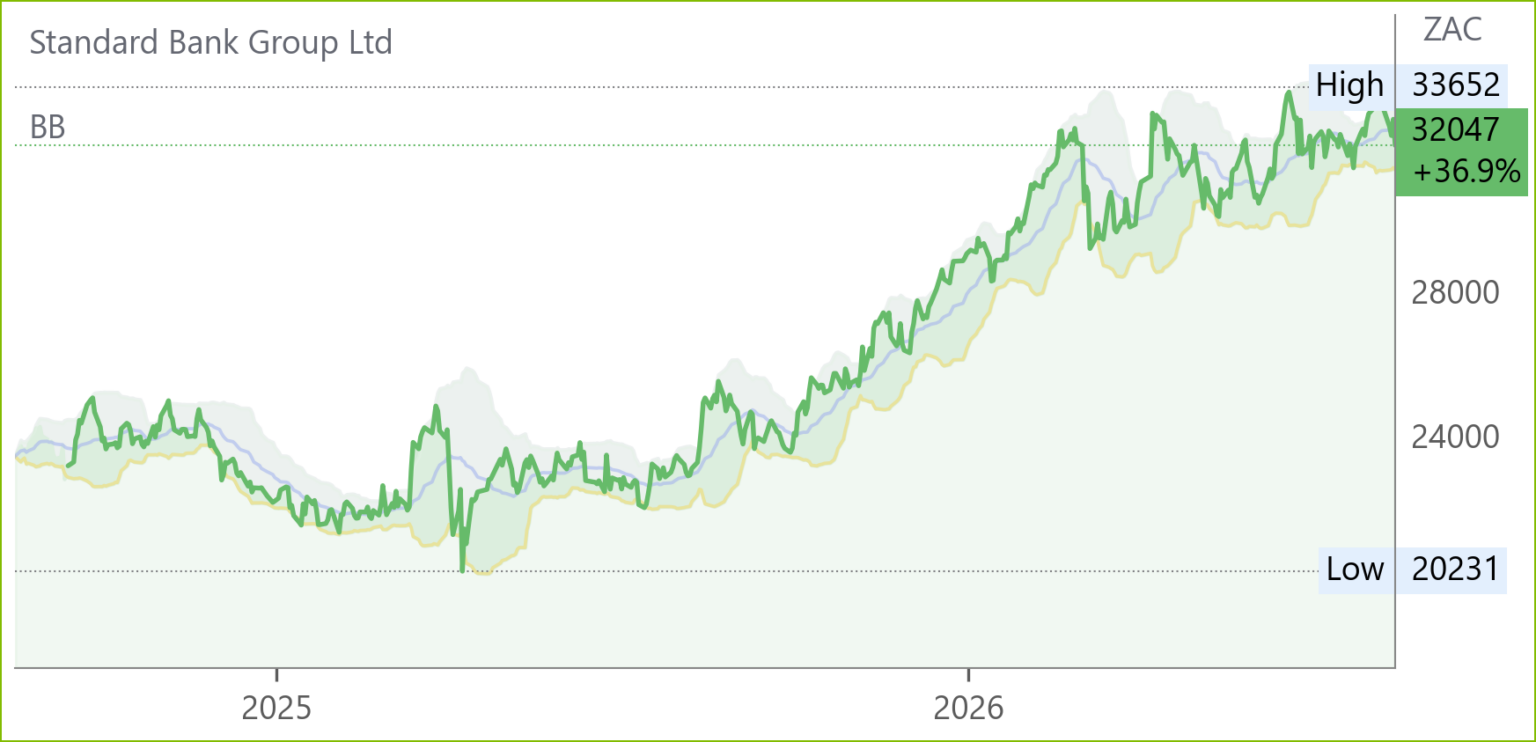
Standard Bank* (SBK) Interim Results for 6M Jun ’26 (32772c)
HEPS: 1 609.8c (+10% from 1 458.0c)
EPS: 1 615.6c (+11% from 1 460.6c)
Revenue: R98.98bn (+4% from R94.79bn)
Dividend: 902c interim (+10% from 817c)
Headline earnings rose to R26.1bn, driven by strong balance sheet growth, resilient fee income and lower credit impairments. ROE improved to 19.8%, supported by disciplined capital allocation and robust risk management. Digital client growth in South Africa accelerated, with transactional volumes up 17%. AI deployment scaled rapidly, with 72% of employees active users and over 10m personalised client interactions delivered. CEO Sim Tshabalala stated: “In 1H26, Standard Bank Group delivered another record performance, with headline earnings and dividend per share up 10% and return on equity improving to 19.8%.”
Comment: Standard Bank remains the standout banking leader in Africa with its Africa regions having grown at an average of 14% p.a. since 2015 during which time Nedbank languished with its minority interest in Ecobank. Although Nedbank’s belated move into East Africa constitutes a major improvement in its long term outlook it has a long way to go and, while on the topic, CEO Sim Tshabalala explicitly disavowed any M&A intentions whatsoever with its local peer. He did, however, assert that he saw many opportunities for expansion and continued growth in Africa which comprises 40% of group earnings with West Africa, including Angola, leading in these results. The 40% stake in Standard Bank ICBC in London, which used to be a drag on group progress when it had a majority stake, contributed R1bn and 4% to earnings with dealings in precious metals featuring. Management confirms it will now retain this stake. Guidance for 2028 is confidently being maintained and, with management reminding us that Sub-Saharan Africa is the fastest growing major region in the world, the stock remains in contention for inclusion in any long term portfolio and can be bought now.

AECI (AFE) Interim Results for 6M Jun ‘26 (10650c)

HEPS: 653cps (+8% from 604cps)
EPS: 348cps (+18% from 294cps)
Operating Profit: R837m (+20% from R699m)
Revenue: R15,073m (‑4% from R15,690m)
EBITDA: R1,606m (+2% from R1,573m)
Dividend: 116cps interim (vs. 100cps prior)
Revenue declined 4% to R15,073m, reflecting weaker demand in parts of Chemicals and portfolio changes, while EBITDA rose 2% to R1,606m and operating profit increased 20% to R837m on improved mining performance, lower costs and reduced depreciation. EPS rose 18% to 348cps and HEPS 8% to 653cps; the HEPS/EPS gap reflects R330m impairment charges, mainly at AECI Schirm Germany. Net debt reduced to R1,738m from R2,923m, while free cash flow swung to a R952m outflow due to working capital absorption. Dividend increased to 116cps.
Comment: AECI has delivered a good set of results, although revenue fell 4%, operational efficiencies saw margin levels maintained and growth in HEPS and EPS. Despite some improving financial metrics, like reduced debt and gearing, CEO Alan Dickson and his team were, at best, cautious about short to medium term headwinds. Rising costs from the war in the Middle East, the Schirm Germany operation returning to operating losses, the uncertain impact of a super El Nino, and several operating challenges still remain present (particularly in Germany). Management’s cautionary attitude is further highlighted in their dividend declaration, which sees dividend coverage at 3.0x, towards the upper end of their guided policy of 1.5x to 3.5x. AECI remain committed to returning capital to shareholders through annual dividends, so for those holding the stock, the share can remain a hold with better medium to long term growth prospects. The next period is going to be shaped by several uncertainties management simply cannot control, and a wait and see approach to the next set of results seems prudent.

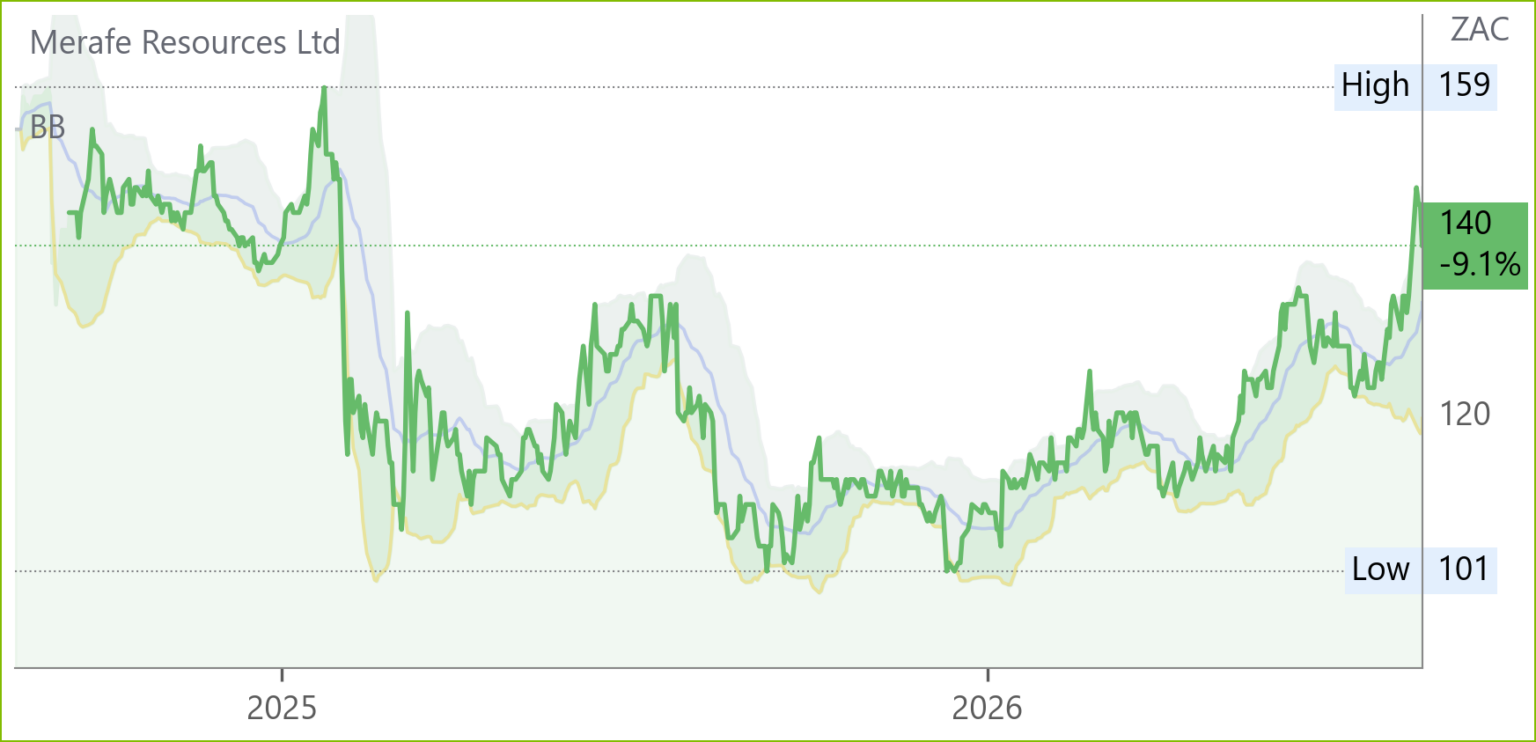
Merafe (MRF) Financial Results for 6M Jun ’26 (145c)
HEPS: 20.7cps (+64% from 12.6cps)
EPS: 20.5cps (+120% from 9.3cps)
Operating Profit: R512m (+120% from R233m)
Revenue: R3,433m (+36% from R2,519m)
EBITDA: R774m (+60% from R483m)
Dividend: 16cps interim (vs. 4cps prior)
NAV: R5,031m (+7% from R4,719m)
Earnings surged on higher chrome ore sales volumes (+75% to 380kt) and stronger commodity prices, despite a 75% drop in ferrochrome production to 28kt. Cash generation improved markedly, with R976m net cash from operations versus an outflow of R175m in the prior period. CEO Zanele Matlala highlighted resilience: “Strong earnings growth underscores the successful execution of our strategy to maximise value from chrome operations.” Outlook remains cautiously optimistic, supported by reduced Eskom tariffs and improved power supply, though margins may face pressure from Chinese ferrochrome oversupply.
Comment: management made it very clear that the 62c/kWh tariff finally squeezed out of Eskom and Nersa for its ferrochrome smelters is not a path to significant profitability but will merely enable the company to retain its workforce and be able to sell into the Chinese market. The deal stipulates that, should Merafe make significant ferrochrome profits it would have to give some back to Eskom. Currently management is very much in cost cutting mode including payroll where possible. That said, when ferrochrome production has ramped up again towards year end, FY 27 will benefit from the likely swing from the negative 10% contribution to 1H26 Ebitda to at least positive or a little better, In addition, the FeCr operation pays market prices for chrome which will help the chrome ore contribution which was 75%. Not much was said about the PGMs operation which contributed 20% to ebitda but, with Glencore in charge, a modicum of growth is possible. If nothing else, therefore, the stock can be bought by the patient investor for yield with, at this stage, the speculative possibility of some growth from chrome ore and PGMs.

Resilient REIT (RES) Interim Results for 6M Jun ’26 (8170c)

HEPS: 281.78cps (+24.5% from 226.23cps)
EPS: 278.85cps (+57.3% from 177.30cps)
Revenue: R1.99bn (+3.4% from R1.93bn)
Dividend: 274.38cps interim (+11.7% from 245.72cps)
NAV: R77.40 per share (+11% from R69.83)
LTV: 36.1% (improved from 37.8%)
Distributable earnings strengthened, with interim dividend up 11.7% to 274.38cps. Net property income in South Africa grew 6% on a like‑for‑like basis, supported by rental renewals (+2.5%) and new leases (+7.1%). Offshore assets contributed positively, with Lighthouse euro dividend per share rising 9.7% and Spanish Salera centre sales up 8.5%. Energy initiatives advanced, adding 10MWh battery storage and expanding solar capacity to 94.4MWp, covering 43.2% of electricity needs. NAV per share increased 11% to R77.40, while LTV improved to 36.1%. CEO Johann Kriek emphasised resilience of the portfolio and energy strategy shielding earnings from rising tariffs.
Comment: Leasing fundamentals remain strong with vacancies at 1.9% and renewals positive at 3.2%. However, comparable sales growth slowed to 2.9% from 4.9%, raising tenant affordability concerns. Trading at a premium to NAV and below‑average forward DIPS growth, valuation looks demanding – we maintain a cautious investment stance.

Weaver Fintech (WVR) Interim Results for 6M Jun ’26 (5100c)

HEPS: 256.5cps (‑10% from 285.5cps)
EPS: 256.5cps (‑10% from 285.5cps)
Operating Profit: Trading profit up 2% (R320m)
Revenue: R2.8bn (+10% from R2.55bn)
Revenue grew 10% to R2.8bn, supported by payments‑led ecosystem expansion across lending, payments and insurance. Fee‑based income rose 43%, while trading profit increased modestly by 2% as profitability was impacted by credit performance, payment processing issues and higher provisions. Liquidity remains strong with R1.1bn cash and facilities available. Customer base expanded to 5.1m (+30%), reinforcing digital adoption. CEO Sean Wibberley stated: “Our flywheel is accelerating. Payments provide the entry point, new products unlock growth and cross‑sell, data and analytics deepen our moat, and frequent customer engagement drives exponential value creation.”
Comment: The story coming out of Weaver Fintech is looking positive, despite a shaky H1. Credit impairment losses rose 44% this quarter, translating 10% revenue growth into a 9% PBT decline. Management has acted swiftly, improving collection practices and shortening loan terms across the retail and fintech books to tighten their lending criteria. While the company is not returning capital to shareholders this period as credit normalises, the growth strategy is yielding real results. Customer growth is up 17%, customers with two products up 29%, and ARPU up substantially, indicating additional vertical offerings are adding value rather than cannibalising existing products.
The vision they are presenting going forward feels like a mini Discovery, with verticals across payments, insurance, lending, health, lifestyle, engagement and wealth, reminiscent of the integrated ecosystem approach Discovery has built across its own portfolio. Accumulating positions at this level seems reasonable for investors with a longer term horizon. We will need to see the next results, however, to confirm the lending books have been secured and no further impairments are expected.

Trading Statements & Updates
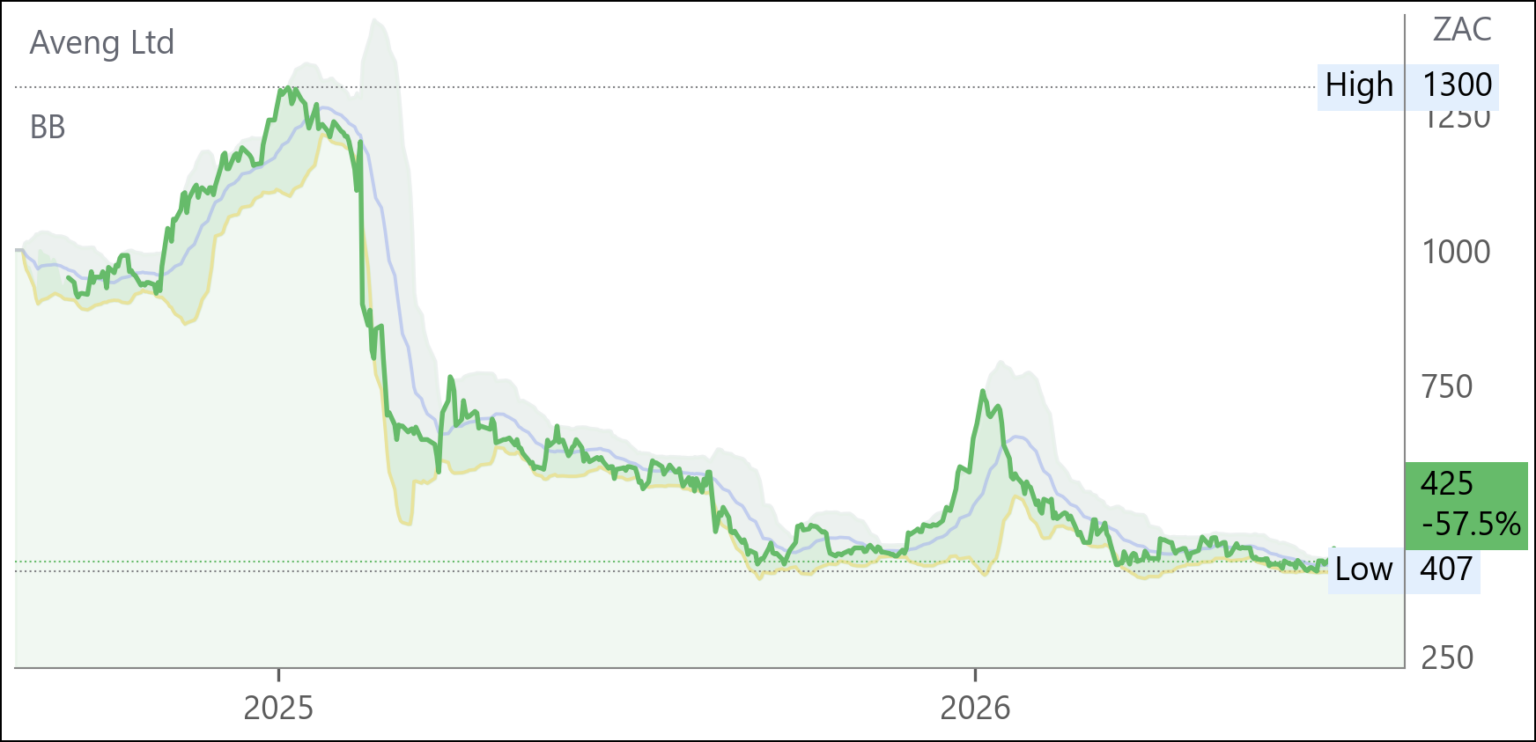
Aveng* (AEG) Trading Statement for FY26 (425c)
HEPS: (4.2cps) – (2.3cps) loss vs FY25(‑93.5% to ‑96.4% from ‑64.6cps)
EPS: (13.4cps) – (11.0cps) loss vs FY25(‑81% to ‑84% from ‑70.4cps)
Losses narrowed significantly, with headline loss per share improving by over 93% to between 2.3cps and 4.2cps, compared to 64.6cps in FY25. Basic loss per share reduced to 11–13cps from 70cps, reflecting improved operational performance and restructuring benefits. Headline loss is expected to fall to A$3m–A$5.5m from A$84.6m, while total loss reduces to A$14.4m–A$17.6m from A$92.3m. The trading statement signals a turnaround trajectory, though profitability remains elusive. Results due 24 Aug ’26.

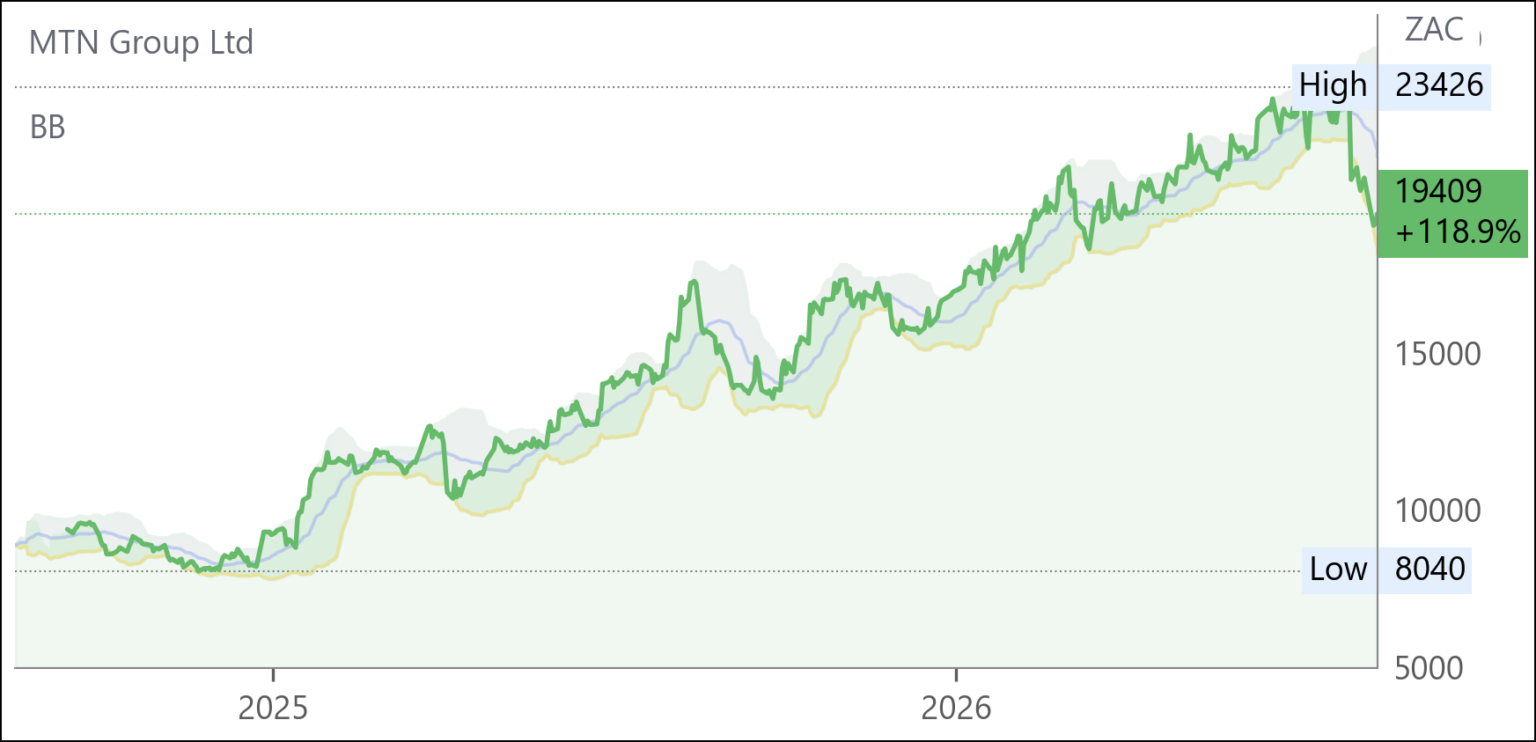
MTN* (MTN) Trading Statement for 6M Jun ’26 (19100c)
HEPS: 580–645cps (‑10% to 0% from 645cps)
EPS: 377–431cps (‑20% to ‑30% from 539cps)
Adjusted HEPS: 775–808cps (+18% to +23% from 657cps)
EBITDA: Strong margin expansion (no figure disclosed)
Earnings were impacted by a R213c impairment of the Irancell investment due to the war in Iran, alongside hyperinflation and forex losses. Reported EPS fell 20–30%, while HEPS declined up to 10%. Adjusted HEPS, which strips out non‑operational items, rose 18–23%, reflecting solid underlying performance. Service revenue grew in line with guidance, though Nigeria fintech was pressured by regulatory suspension of airtime advance, and South African prepaid voice remained weak. Free cash flow strengthened with higher upstreaming to the Group. Progress continues on the IHS acquisition, pending final regulatory approvals. Operations in Nigeria, Ghana and Uganda delivered solid results.
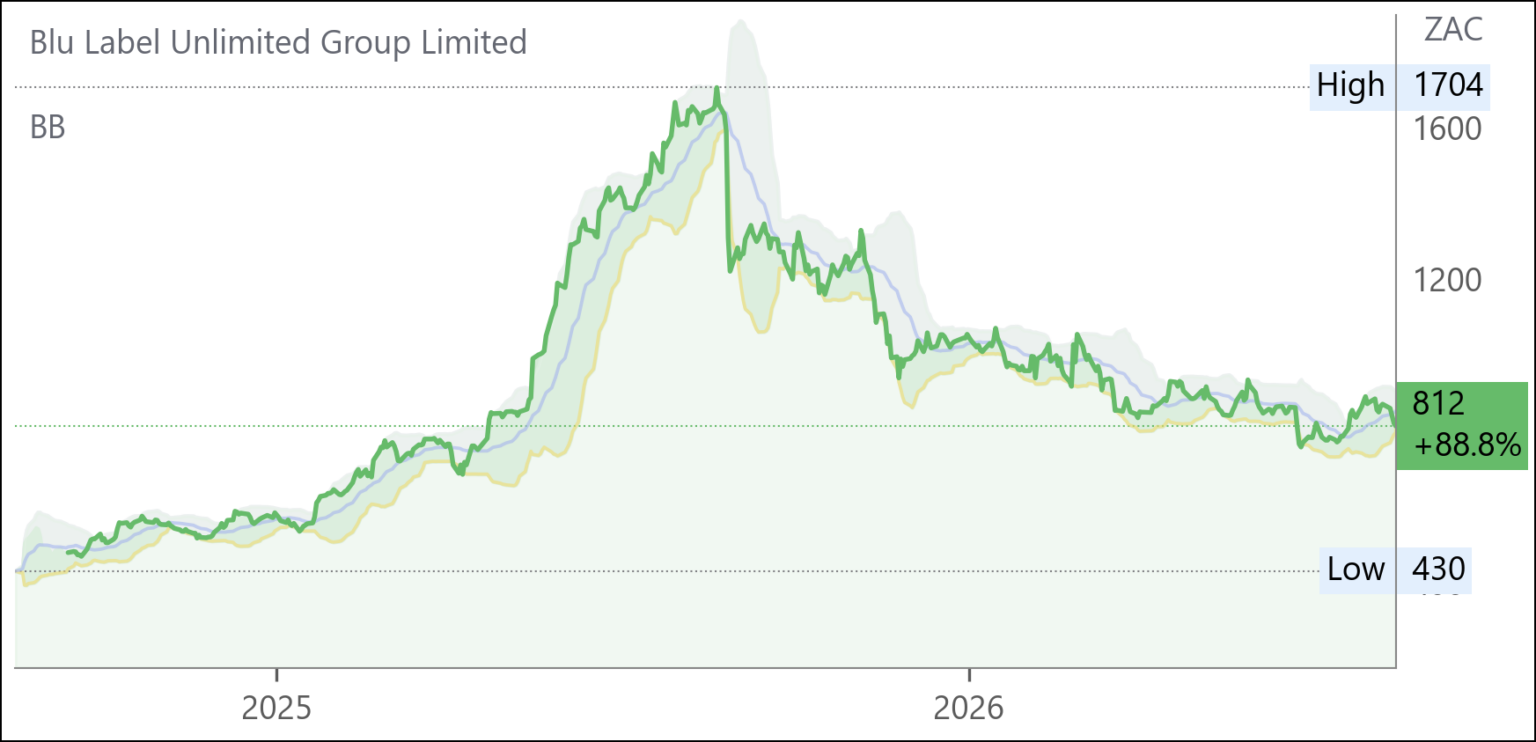
Blu Label (BLU) Trading Statement for FY May ’26 (832c)
HEPS: 79.02–88.14c (-83% to -81% from 455.96c)
EPS: (542.50c) – (536.96c) (>100% decline from 276.52c)
Revenue: R9.4bn (ex‑Cell C)
Gross Profit: R2.555bn (ex‑Cell C)
EBITDA: R923m (ex‑Cell C)
Reported earnings collapsed due to accounting effects from the Cell C restructuring and listing, with EPS swinging into a loss and HEPS down over 80%. Excluding Cell C, BLU delivered revenue of R9.4bn, EBITDA of R923m and net profit of R677m, underpinned by R99.9bn imputed gross revenue from prepaid services. Management emphasised that underlying operations remain profitable and provide a stronger earnings base going forward. Results due 26 Aug ’26.

Grindrod* (GND) Trading Statement for 6M Jun ’26 (2403c)
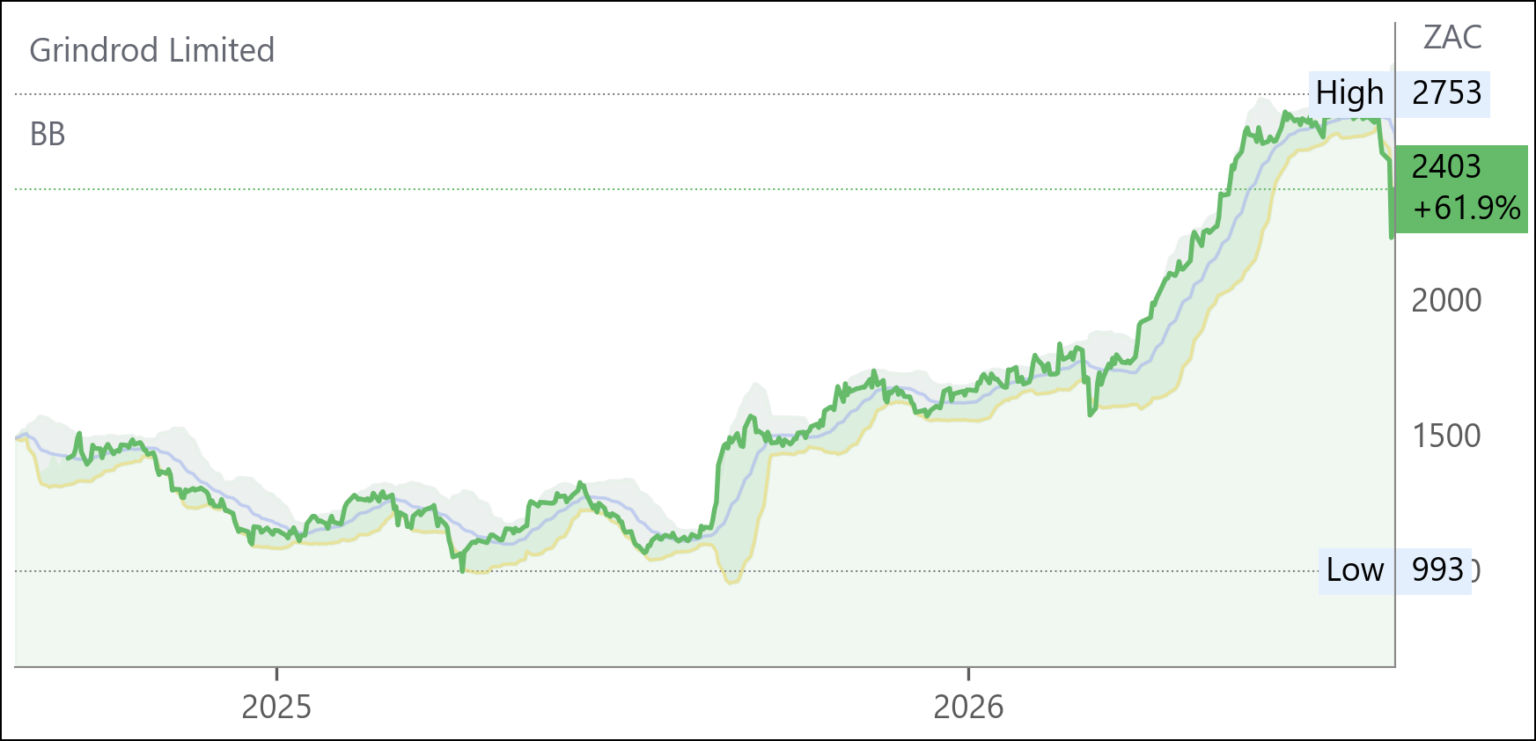
HEPS: 85.0–92.5cps (‑4.2% to +4.3% from 88.7cps)
EPS: 85.9–93.4cps (‑57.5% to ‑60.9% from 219.8cps)
Headline earnings are expected between R567.6m and R617.6m, broadly in line with the prior R592.2m, reflecting stable underlying operations. EPS declined sharply due to the absence of once‑off net profits of R902.8m in the prior period, which arose from foreign currency translation reserves released on the Matola terminal acquisition and the exit from the marine fuel trading joint venture. HEPS remained resilient at 85.0–92.5cps, underscoring operational stability despite the lack of extraordinary gains. The trading statement highlights Grindrod’s continued focus on core logistics and port operations, with management signalling confidence in long‑term growth prospects. Results due 25 Aug ’26.

Northam Platinum* (NPH) Trading Statement FY26 (25736c)

HEPS: 3,006.1–3,082.3cps (+689% to +709% from 380.8cps)
EPS: 3,488.0–3,564.2cps (+815% to +835% from 381.4cps)
Operating Profit: R14.2bn (+294% from R3.6bn)
Revenue: R54.0bn (+64% from R32.9bn)
EBITDA: R16.7bn (+241% from R4.9bn)
Dividend: Policy increased to minimum 40% of HEPS (from 25%)
Record production of 938,754oz 4E and chrome concentrate of 1.69m tonnes underpinned a 64% rise in revenue to R54bn, driven by a 57% appreciation in the Rand basket price. Operating profit surged nearly threefold to R14.2bn, while EBITDA expanded to R16.7bn. EPS rose more than eightfold, supported by strong cash generation of R18.5bn and a net cash position of R2.7bn. Safety performance was mixed, with three fatalities at Zondereinde but Booysendal remaining fatality‑free. Strategic milestones included commissioning of 3 shaft at Zondereinde and an 80MW solar facility. The board raised its dividend policy to a minimum 40% of HEPS, aligning with historical payout levels.
Impala Platinum (IMP) Trading Statement FY26 (20388c)

HEPS: 2,429–2,652cps (+2,860% to +3,134% from 82cps)
EPS: 3,343–3,566cps (+3,832% to +4,095% from 85cps)
Revenue: Achieved revenue per 6E ounce R38,116 (+51% from R25,300)
EBITDA: ~R43.6bn (vs. R6.5bn prior, +570%)
Free Cash Flow: Improved to R22bn (vs. R1bn prior)
Earnings rebounded sharply, supported by stronger precious and base metal pricing, lifting achieved revenue per 6E ounce by 51%. Refined and saleable 6E production rose 5% to 3.56Moz as in‑process inventory was reduced. EBITDA expanded to R43.6bn, while free cash flow improved to R22bn, reflecting operational efficiency and disciplined capital allocation. EPS benefitted from an R8.1bn impairment reversal at Rustenburg, equivalent to 904cps. Headline earnings rose to R21.8–R23.8bn, a dramatic recovery from R0.7bn in FY25. Results due 3 Sep ’26.

Gold Fields (GFI) Trading Statement & Operational Update for 6M Jun ’26 (64200c)

HEPS: US$1.98–US$2.18 (+72–90% from US$1.15)
EPS: US$1.97–US$2.17 (+71–89% from US$1.15)
Free Cash Flow: US$2,385m–US$2,636m (+91–111% from US$1,251m)
Earnings growth was driven by higher gold‑equivalent ounces sold and stronger realised gold prices, partly offset by increased costs. Group production rose 12% to 1,260koz, while AIC and AISC climbed 8% and 13% respectively due to higher royalties and sustaining capital. Operational highlights include Salares Norte outperforming guidance, Gruyere improving output but facing labour turnover risks, and Tarkwa showing recovery yet still at risk of missing full‑year targets. The Windfall project advanced with an Impact Benefit Agreement signed with the Cree Nation, though EIA approval is pending in H2 ’26. Full‑year production guidance of 2.4–2.6Moz remains intact, with costs expected at the lower end of prior ranges.
DRDGOLD (DRD) Trading Statement FY26 (3904c)

HEPS: 481.2c – 507.2c (+85% to +95% from 260.6c)
EPS: 481.4c – 507.4c (+85% to +95% from 260.1c)
Revenue: R11.16bn (+42% from R7.88bn)
Revenue surged 42% to R11.16bn, driven by a 40% increase in the Rand gold price received and stable production volumes. Gold output of 155,577oz exceeded guidance, while cash operating costs of R967,544/kg remained below forecast, reflecting disciplined cost control despite higher reagent and diesel costs. Capital expenditure rose 57% to R3.53bn, funding Vision 2028 projects including the commissioning of the Daggafontein TSF and FWGR’s DP2 plant expansion. Cash holdings doubled to R2.77bn, with no bank debt and undrawn facilities, underscoring strong liquidity. Results due 19 Aug ’26.

Shoprite (SHP) Operational Update for 52W Jun ’26 (31180c)
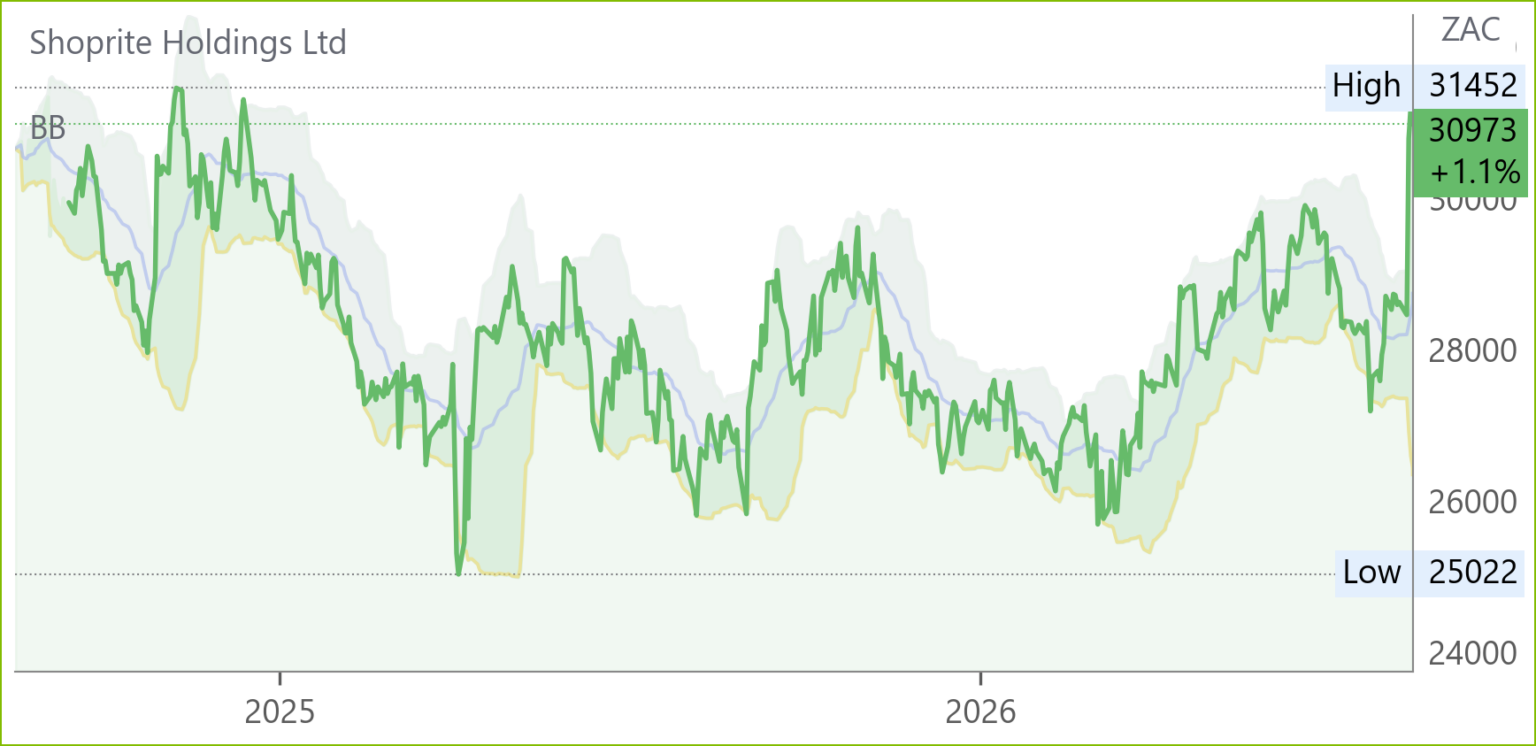
HEPS: 1,498.4–1,566.6cps (+9.7% to +14.7% from 1,365.9cps)
Revenue: R270.8bn (+7.2% from R252.7bn)
Group sales rose 7.2% to R270.8bn, supported by Supermarkets RSA (+7.1%) and Non‑RSA (+11%). Checkers delivered 10% growth, LiquorShop 14.5%, and Sixty60 online surged 34.5% to R25.5bn. New formats such as Petshop Science and Uniq Clothing expanded 57%. Non‑RSA operations grew store base to 276, with Zambia up 27% in reported currency. Furniture division disposal to Pepkor generated R568m, while the SA disposal awaits Competition Tribunal approval.
Truworths (TRU) Business Update and Voluntary Trading Statement for 52W Jun ’26 (5495c)
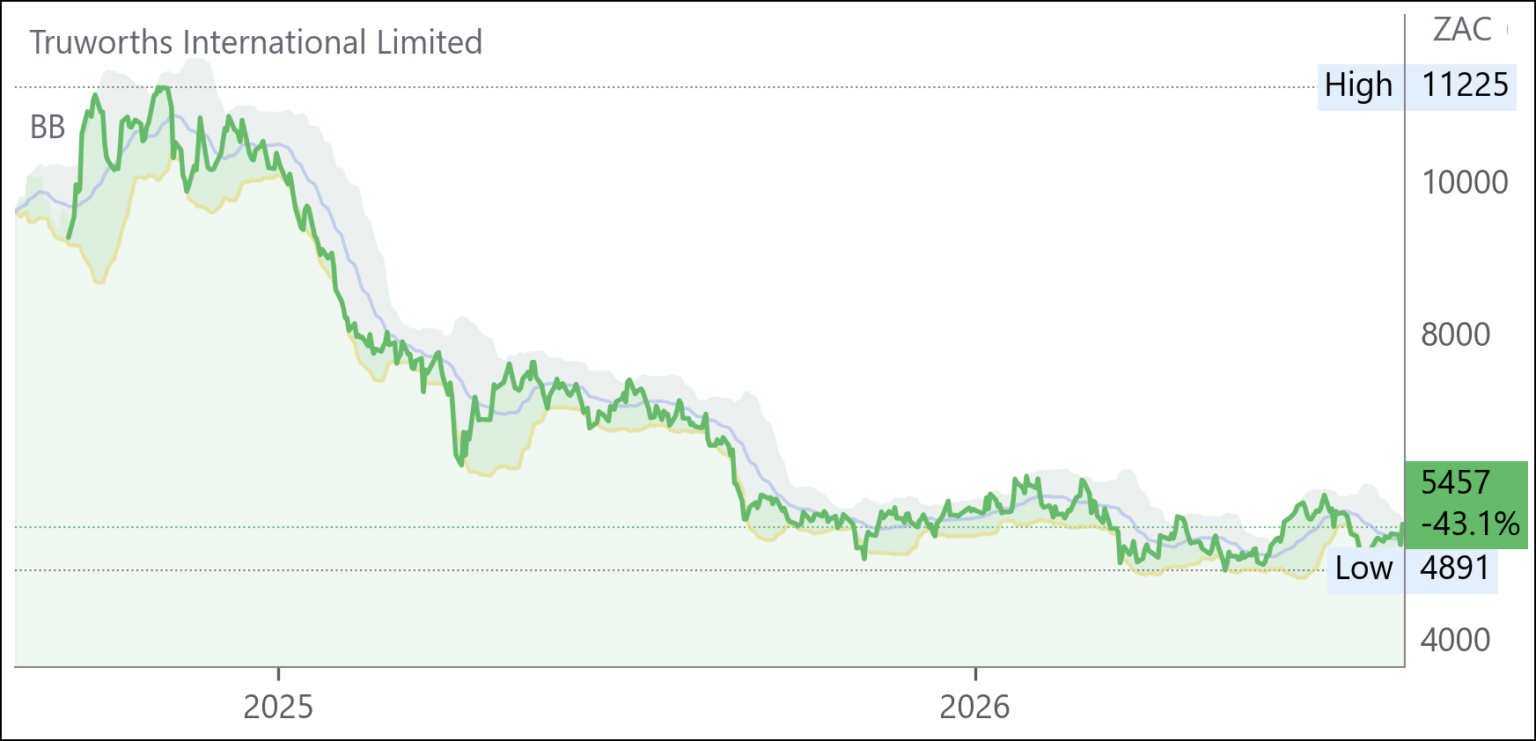
HEPS: 722–737c (-2% to -4% from 752.1c)
EPS: 715–730c (-2% to -4% from 745.2c)
Revenue: R21.8bn (-0.9% from R22.0bn)
Group retail sales fell 0.9% to R21.8bn, with Truworths Africa down 2.1% despite online growth of 21.5% lifting contribution to 8.1%. Office UK grew 4.9% in Sterling, outperforming its market, supported by a 17.8% increase in trading space. Active account holders able to purchase declined to 77% (2025: 79%), reflecting consumer strain. Management emphasised strong cash generation, net cash position, and expanding online presence as key strengths. Results due 27 Aug ’26.
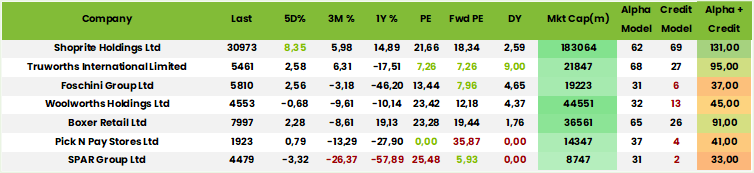
Rainbow Chicken (RBO) Trading Statement FY26 (625c)

HEPS: 143.00c – 156.12c (+118% to +138% from 65.57c)
EPS: 141.87c – 154.68c (+122% to +142% from 64.04c)
Strong poultry demand and lower feed input costs underpinned a sharp recovery in earnings, with HEPS and EPS more than doubling year‑on‑year. Operational efficiencies and improved agricultural yields contributed to the turnaround. Management noted that favourable market conditions supported profitability, positioning the business for sustained growth. Results due 28 Aug ’26.

Exxaro* (EXX) Trading Statement for 6M Jun ’26 (19110c)

HEPS: 1414–1327c (-18% to -23% from 1724c)
EPS: 1408–1322c (-18% to -23% from 1717c)
EBITDA: broadly in line with prior period
Earnings contracted sharply due to weaker equity-accounted income from Sishen Iron Ore and Black Mountain Mining. Sishen was impacted by Rand strength and inflationary mining costs linked to Middle East conflict, while BMM faced higher costs and delays at Gamsberg. EBITDA remained stable, reflecting operational resilience despite earnings pressure. Management highlighted strong cash generation and balance sheet strength. Results due 20 Aug ’26.

Advtech (ADH) Trading Statement for 6M Jun ’26 (4609c)

HEPS: 127.4–133.3cps (+13–18% from 112.7cps)
EPS: 127.4–133.3cps (+13–18% from 113.0cps)
NEPS (Normalised): 127.4–133.3cps (+13–18% from 113.0cps)
Strong earnings momentum is expected, with NEPS, HEPS and EPS all rising between 13% and 18% year‑on‑year, reflecting resilient demand across education and staffing divisions. NEPS excludes one‑off transactions and corporate action costs, providing a clearer view of underlying performance. The trading statement highlights continued operational progress despite macroeconomic pressures. Results due 24 Aug ’26.
Stadio (SDO) Voluntary Trading Statement for 6M Jun ’26 (1245c)
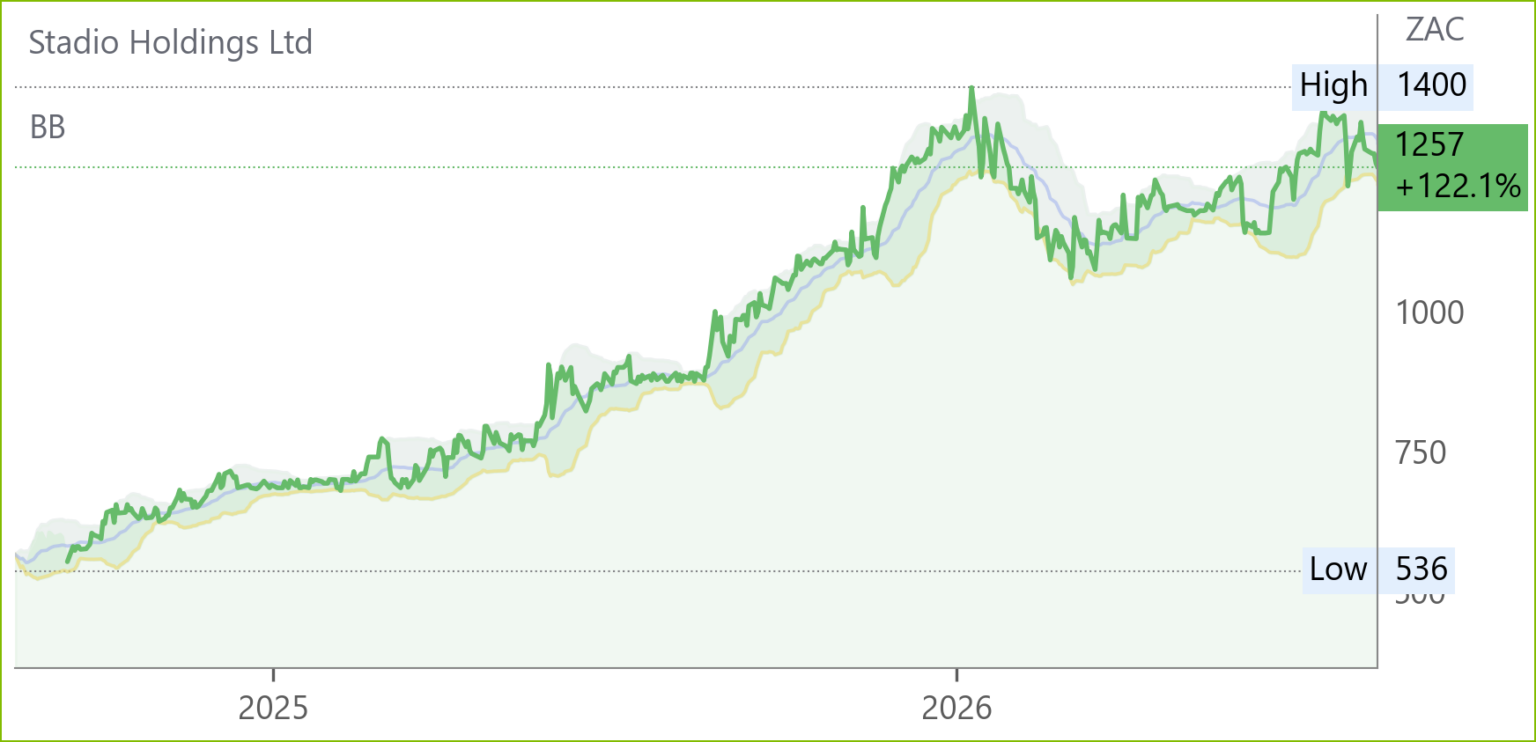
HEPS: 23.2–24.8c (+12.1% to +19.8% from 20.7c)
EPS: 23.2–24.8c (+11.5% to +19.2% from 20.8c)
HEPS and EPS are expected to rise between 12% and 20%, reflecting strong student enrolment growth and operational efficiencies. Core HEPS is projected at 23.7–25.3c, up 14.5%–22.2%, underscoring underlying performance strength. Management emphasised resilience in a challenging macroeconomic environament, supported by investment in new qualifications and digital learning platforms. The Board reaffirmed confidence in sustainable earnings progression and long‑term growth strategy. Results due 28 Aug ’26.

Italtile (ITE) Trading Statement & Business Update FY26 (985c)

HEPS: 109.5–115.7cps (‑7.5% to ‑12.4% from 125.1cps)
EPS: 109.7–115.9cps (‑7.7% to ‑12.7% from 125.6cps)
Revenue: Stable across retail; manufacturing sales ‑1%
Trading conditions were pressured by geopolitical conflict, rising fuel and transport costs, and weak demand in construction. Ceramic Industries weighed heavily on results, with margins under severe pressure from predatory pricing and energy costs. Retail turnover at CTM, Italtile Retail and TopT was stable, with Italtile Retail delivering improved sales and TopT modest growth. Webstores achieved strong traffic and sales gains through digital innovation. Import supply chain businesses saw sales decline 6% but offset by margin gains from exchange‑rate benefits. Cash generation remained strong, supporting capex, share buybacks and the highest dividend in Italtile’s history. Brandon Wood assumed the role of Group CEO on 1 Jul ’26, strengthening leadership depth. Results due 24 Aug ’26.