
Global Indices


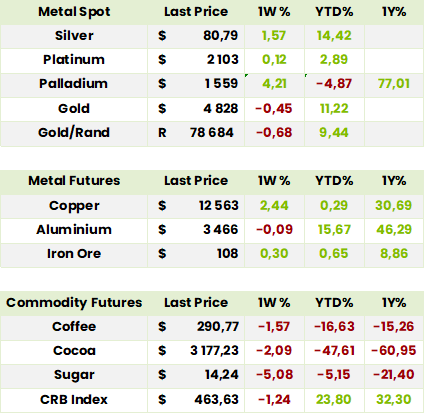
Currencies, Crypto & Commodities

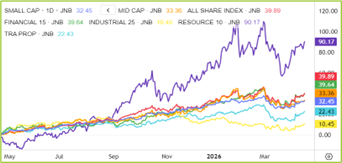
SA Indices

SA Upcoming Indicators & Dividends



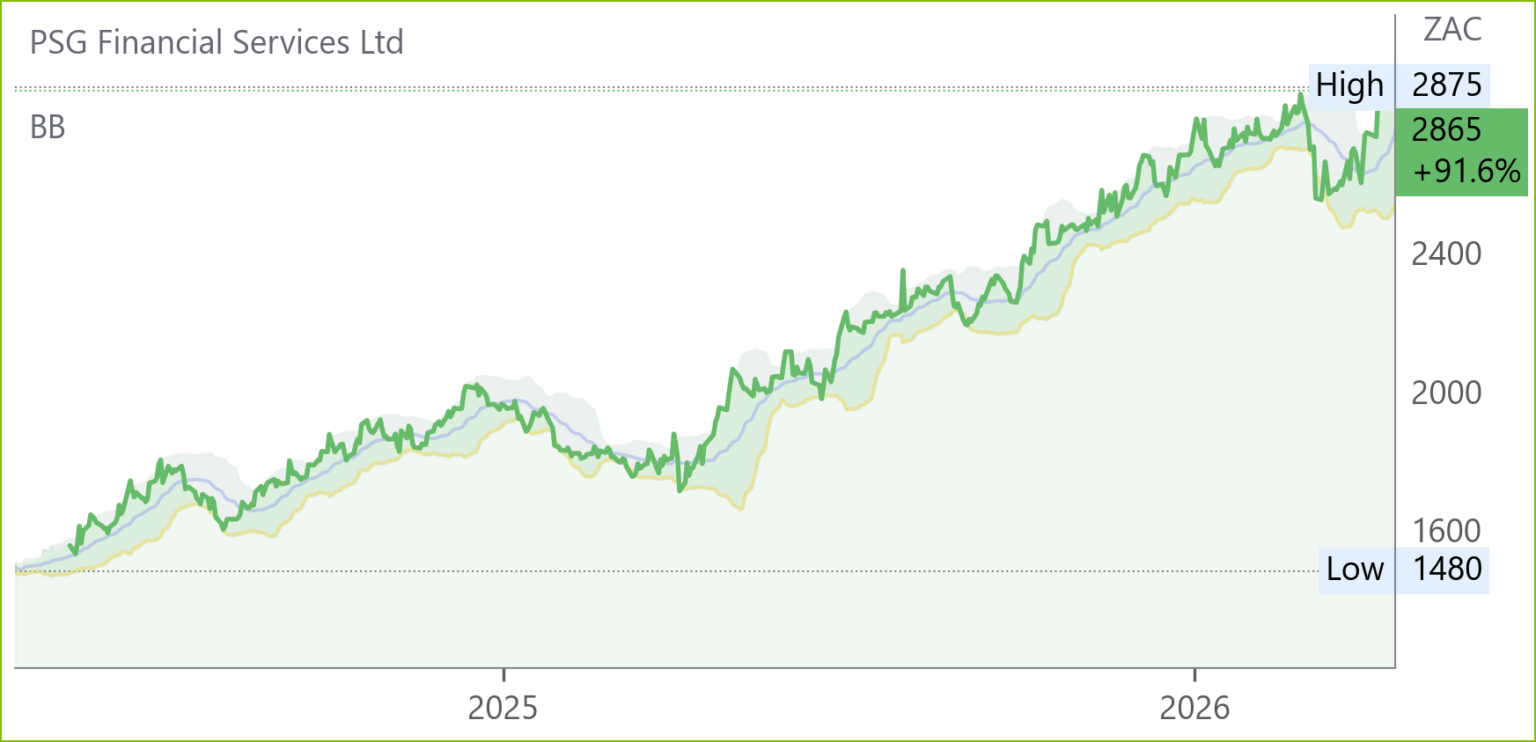
PSG Financial Services (KST) Financial Results FY26 (2865c)
HEPS: 135.0c (↑34% from 101.1c)
EPS: 139.3c (↑38% from 101.2c)
Operating Profit: R1.74bn (↑36% from R1.27bn)
Revenue: R8.28bn (↑22% from R6.80bn)
Dividend: 65.0c/share (final 45.0c; interim 20.0c, ↑25% from 52.0c)
Assets under management rose 20% to R564.6bn, with PSG Wealth contributing R480.9bn and PSG Asset Management R83.7bn. Performance fees increased to 9.2% of headline earnings, reflecting stronger markets. Credit ratings were upgraded to AA-(ZA) and A1+(ZA), while capital cover ratio improved to 260%. The group repurchased 12.3m shares at R296.9m, optimising capital structure. PSG’s outlook balances caution with optimism. Management flagged global debt, political populism, disruptive technologies, and Gulf military tensions as risks, while noting domestic progress in curbing inflation and deficits. However, reforms remain slow and uneven. The firm remains confident in South Africans’ resilience and will continue investing in technology and people, while monitoring conditions carefully through FY26.
Comment: in the FY 26 presentation it is the numbers that do the talking- and they are good! E.g. 4 year heps CAGR was 18% and assets under management (AUM)16%. Over 10 years the heps CAGR was 32%, AUM 20% and DPS 25%! While the market outlook is cloudy and it might be worth waiting for a pullback, the 1.0 x PEG ratio means the stock is by no means overvalued!

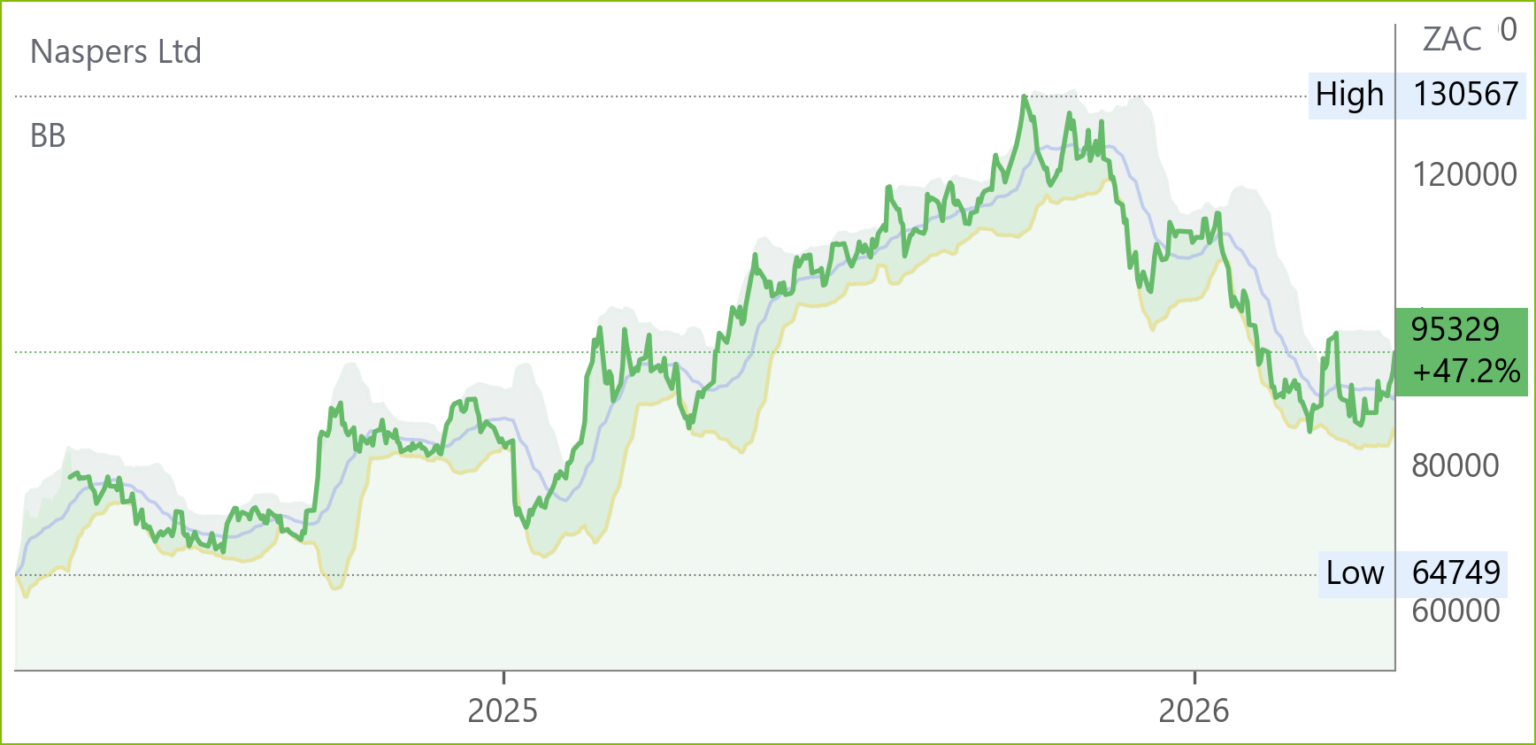
Naspers* (NPN) Review Apr ’26 (95329c)
– Revenue: Exposure via Tencent (RMB 751.8bn FY25, +13.9% YoY)
– Gross Profit: Tencent RMB 422.6bn (+21% YoY)
– EBITDA: Tencent RMB 336.4bn (+21.4% YoY)
The discount to NAV widened to 48%, above historical averages, offering potential upside. Unlisted assets are valued at US$29.5bn, including iFood (US$7.4bn, 20x FY27E EV/EBITDA), OLX (US$7.5bn, 15x FY27E EV/EBITDA), and JET (US$3.75bn, 25% below acquisition cost). Tencent’s AI pivot, doubling capex to RMB 36bn in FY26, is expected to weigh on margins short term but underpins long-term monetisation optionality. Naspers remains Buy-rated, with elevated discounts as an attractive entry point.
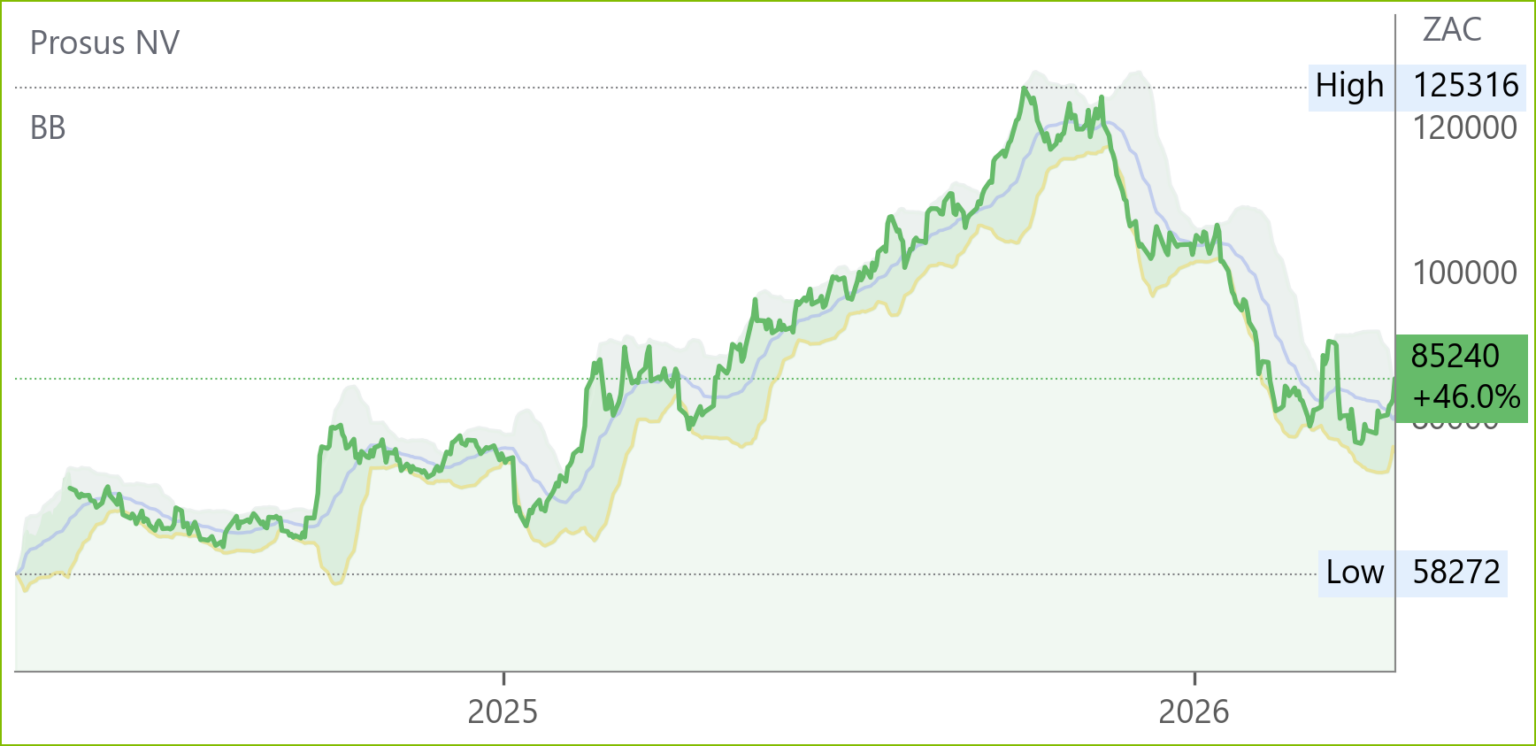
Prosus* (PRX) Review Apr ’26 (85240c)
– Revenue: Tencent contribution (RMB 751.8bn FY25, +13.9% YoY)
– Gross Profit: Tencent RMB 422.6bn (+21% YoY)
– EBITDA: Tencent RMB 336.4bn (+21.4% YoY)
The discount to NAV widened to 44%, assuming 35% in its SOTP model. Tencent remains the key driver, valued at US$173bn (85% of NAV). Other listed assets include Meituan (€1/share), Delivery Hero (€1/share), and Swiggy (€1/share). The unlisted portfolio, valued at US$29.5bn, includes iFood, OLX, and JET, applying conservative multiples. Despite near-term margin pressure from Tencent’s AI investments, Prosus remains Buy-rated, with elevated discounts offering upside.

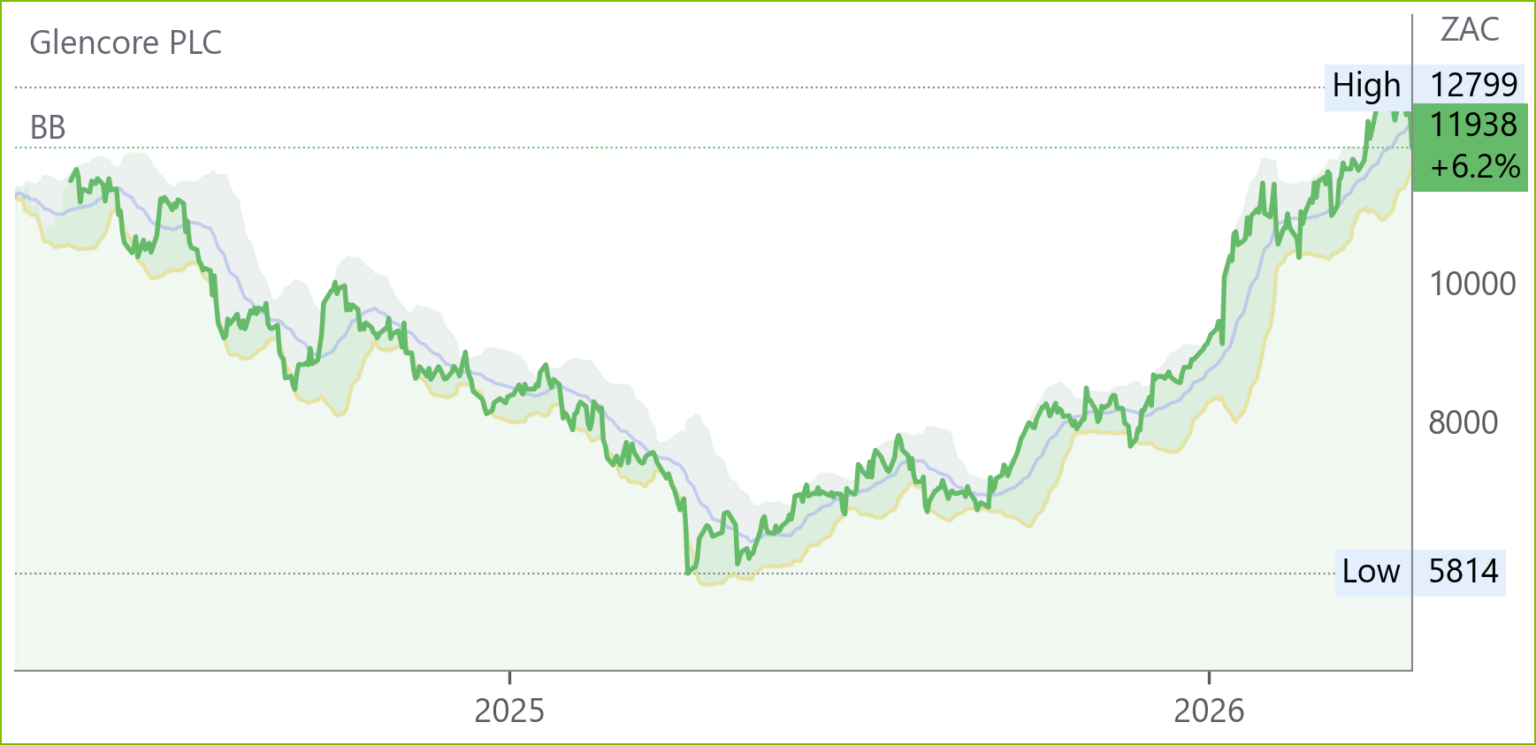
Glencore* (GLN) Preliminary Results FY25 (11938c)
HEPS: USD 3c (↑123% from -13c FY24)
EPS: USD 3c (↑123% from -13c FY24)
Operating Profit: $5.98bn (↓14% from FY24)
Revenue: $247.5bn (↑7% from FY24)
EBITDA: $13.5bn (↓6% from FY24; H2 ↑49% vs H1)
Dividend: USD 17c/share (aggregate $2bn; base 10c + top-up 7c, payable Jun & Sep 26)
Copper production surged in H2 25, with volumes 50% higher than H1 due to stronger grades and recoveries at KCC, Mutanda, Antapaccay and Antamina. Portfolio reshaping included acquiring Quechua copper in Peru and divesting Pasar smelter and Puerto Nuevo terminal. Net income swung to $363m from a $1.6bn loss in FY24. CEO Gary Nagle emphasised copper-led growth: “We expect to be producing over 1 million tonnes annualised by end 2028, targeting c.1.6 million tonnes by 2035.” – Gary Nagle, CEO.
Comment: at ZAR16.40$ the Heps of 16.40c places the stock on a 44.4x PE and, although an easily manageable 25% Heps growth would reduce this to a still high FPE of 20.5x for FY26 the market has been encouraged by the Capital Markets Day presentation on 3 December, when the price was 8673c, in which Gary Nagle forecast that Glencore would be one of the largest copper producers in the world in the next decade. Copper production in FY 25 was 910kt. The marketing business, which contributed 27% to adjusted ebitda, remains a standout, delivering consistent cash flows despite commodity price swings. LNG contracts and trading margins provide a competitive edge, reinforcing Glencore’s ability to monetise volatility. Coal continues to contribute strongly, especially post the Middle East war, but growing exposure to energy transition metals such as brownfield copper and cobalt options enhances long-term relevance. Strong cash generation underpins shareholder returns, though carbon-heavy assets invite regulatory scrutiny.
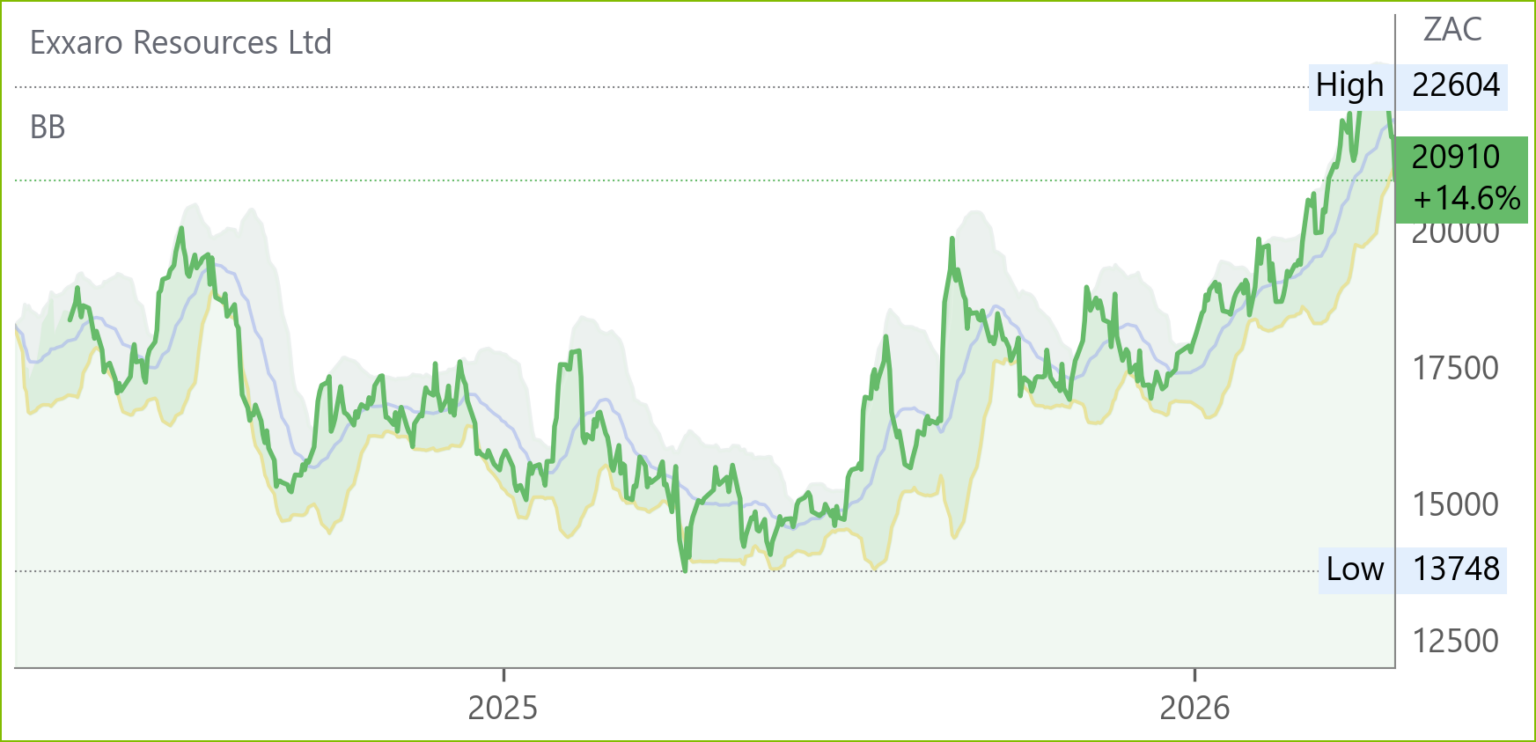
Exxaro* (EXX) Financial Results FY25 (20910c)
HEPS: 3247c (↑8% from 3016c)
EPS: 3178c (↓0.4% from 3192c)
Operating Profit: R7.1bn (↓7% from R7.6bn)
Revenue: R41.8bn (↑3% from R40.7bn)
Dividend: 1000c/share (final; ↑15% from 866c)
Revenue growth was modest, supported by stable coal and energy operations, while net operating profit fell 7% due to softer pricing and cost pressures. HEPS rose 8% despite EPS being marginally lower, reflecting efficiency gains. The board declared a final dividend of 1000c/share, payable 11 May ’26. Chairman Mvuleni Geoff Qhena noted resilience in a challenging market, while CEO Bheki Magara emphasised diversification across energy and metals.
Comment: Coal remains the dominant earnings driver, presenting structural challenges in a decarbonising world. Revenue growth of 2.6% to R41.77bn demonstrates resilience, and dividend payouts remain attractive for shareholders. Investments in renewable energy mark a strategic shift, though coal exposure continues to define the business model. Operational stability and record safety milestones provide near-term confidence, but long-term relevance depends on accelerating diversification. Coal and energy represented 88% and 12% respectively of the R11.7bn ebitda while equity accounted income, mainly the 20.62% share in Shishen Iron Ore Company but also the 26% share in Vedanta’s lead zinc Black Mountain mine, contributed R4.5bn on top of net operating profit of R7.2bn to pre-tax profit of R12.3bn. So, while coal and iron ore comprise the bulk of earnings, energy (solar and wind), although showing steady growth, has yet to move the needle which the newly acquired manganese mine, however, is likely to do.
More acquisitions will help. Export coal prices have soared since the Middle East war and are likely to compensate for the higher trucking costs and inflation.
Thungela (TGA) Financial Results FY25 (12725c)

HEPS: 2676c (↑314% from -647c)
EPS: 3544c (↑301% from -5464c)
Revenue: R29.6bn (↓17% from R35.6bn)
EBITDA: R1.2bn (↓81% from R6.3bn)
Dividend: 400c/share (final; full year 400c)
Export saleable production rose to 17.8Mt, exceeding guidance, supported by Mafube and ramp-up at Annea Colliery. Net loss of R7.1bn was driven by R8.8bn non-cash impairments linked to weaker coal prices and FX movements. Safety milestones included three consecutive years fatality-free. Projects at Annea and Zibulo North were completed, while Isibonelo mine closed. CEO Moses Madondo stated: “Our 2025 results demonstrate strong operational performance, highlighting our ability to control the controllables in a challenging thermal coal market environment.” – Moses Madondo, CEO.
Comment: Thungela’s earnings remain highly leveraged to thermal coal prices, which supported strong cash generation in the recent period. Dividend payouts continue to be attractive, reinforcing its income appeal. However, operational risks, including logistics constraints on Transnet rail, are highlighted as a drag on export volumes. Management remains focused on cost discipline and maintaining shareholder returns, but long‑term relevance is questioned given global decarbonisation trends. Near‑term performance is expected to remain robust while coal prices hold, though structural challenges in South Africa’s infrastructure and energy transition weigh on the outlook.

Blu Label Unlimited (BLU) Review following Cell C (CCD) Disposal ‘Apr 26 (930c)

HEPS: 44.17c (↓16% from 46.01c)
EPS: -555.56c (↓1,363% from 43.98c)
Revenue: R8.64bn (↑19% from R7.25bn)
Operating Profit: -R4.1bn (↓730% from R653m)
Normalised Gross Profit: R1.35bn
EBITDA: -R4.1bn (↓730% from R653m)
Normalised EBITDA: R535m
Dividend: 43.56c interim dividend declared
Following the Cell C disposal, Blu Label is positioning itself as a broader digital distribution, payments and infrastructure platform. The core business remains high-volume, low-capital-intensity transaction enablement across prepaid airtime and data, SIMs, devices, prepaid electricity, vouchers, ticketing and bill payments. Management’s messaging is now focused on defending this cash-generative base, improving revenue quality, and scaling adjacent platforms in energy, digital services and enablement.
Comment: Blu Label is using proceeds from the Cell C disposal to pay down debt and manage working capital. Management declaring an interim dividend for the first time in years is a good sign and shows they are confident in the company’s ability to generate cash going forward. If dividends continue to be paid in future periods, this should help rebuild investor confidence.
The exit from Cell C also cleans up the investment case significantly. A lot of the negative sentiment around Blu Label was linked to the troubles at Cell C, and with that now behind them, the outlook looks more positive. This sentiment seems to be gaining traction, with more investment professionals talking positively about the stock over the past several months.

Trading Statements & Updates
Tharisa (THA) Production Report Q2 FY26 (2705c)

PGM Production: 34.3 koz (↓11.6% from Q1 FY26)
Chrome Production: 404.0 kt (↑15.6% from Q1 FY26)
PGM Basket Price: US$3 038/oz (↑37.6% from Q1 FY26)
Chrome Price: US$290/t (↑5.1% from Q1 FY26)
Cash Balance: US$184.3m (↑51% from Dec ’25)
Debt: US$129.6m (↑72% from Dec ’25)
Net Cash Position: US$54.7m (↑16% from Dec ’25)
PGM output fell due to lower reef grades, while chrome production rose on stronger feed grades. EBITDA and revenue benefited from higher commodity prices. Underground mining commenced at the Apollo portal, marking a strategic shift with over 60 years of potential mine life. Karo Platinum in Zimbabwe progressed with site clearing and funding negotiations.
“This quarter’s results reflect the resilience and operational discipline that define Tharisa, underpinned by our continued strong safety performance.” – Phoevos Pouroulis, CEO.

Snippets
Prosus* (PRX) announced the sale of a 4.5% stake in Delivery Hero to Uber for €270m, at €20.00 per share, representing a 22% premium to the 1‑month VWAP. This reduces Prosus’s holding from 26.3% to 21.8% and fulfils European Commission commitments linked to its Just Eat Takeaway acquisition. Management confirmed plans to dispose of the remaining stake within regulatory timelines, emphasising shareholder value maximisation.