Finova Investor Digest
Global Indices, Currencies, Crypto & Commodities
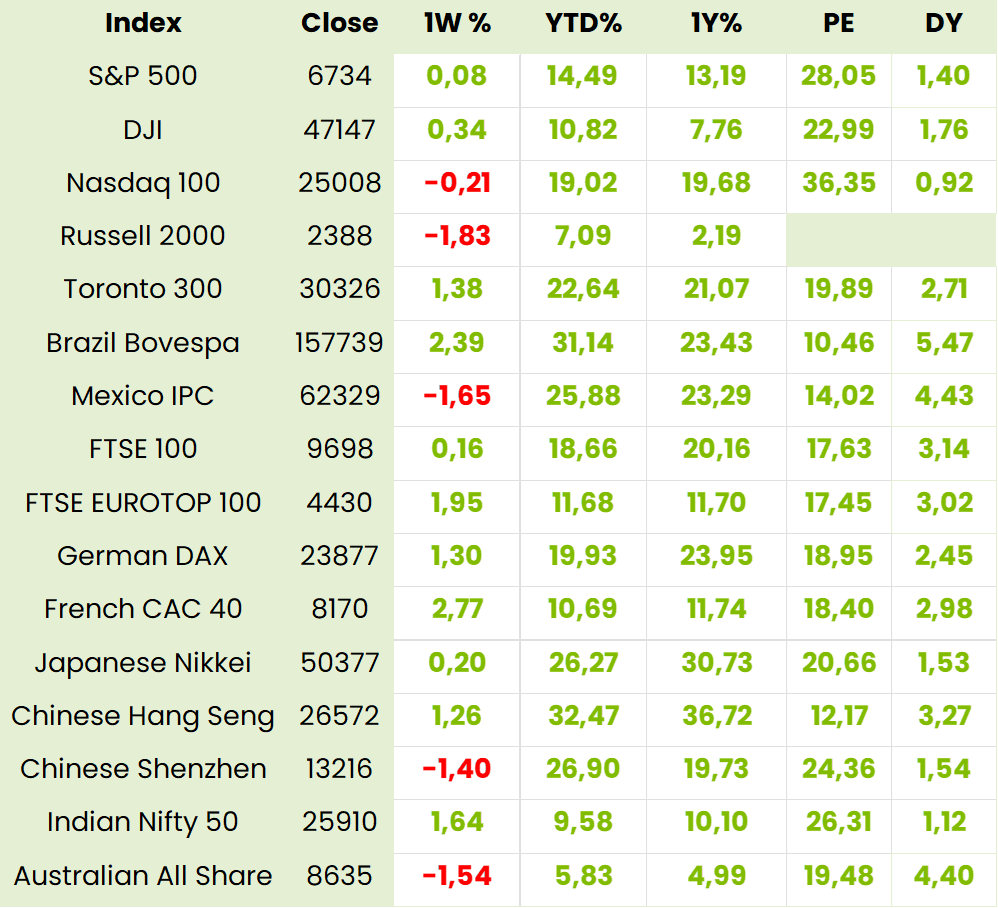
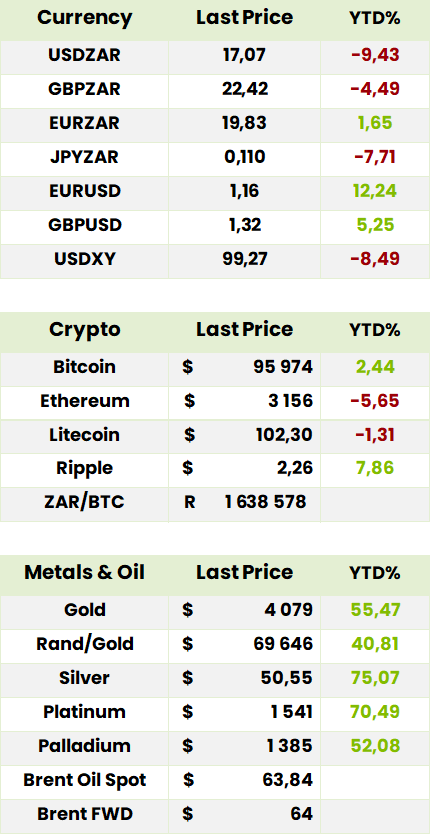
Global Indices 1 year to Date

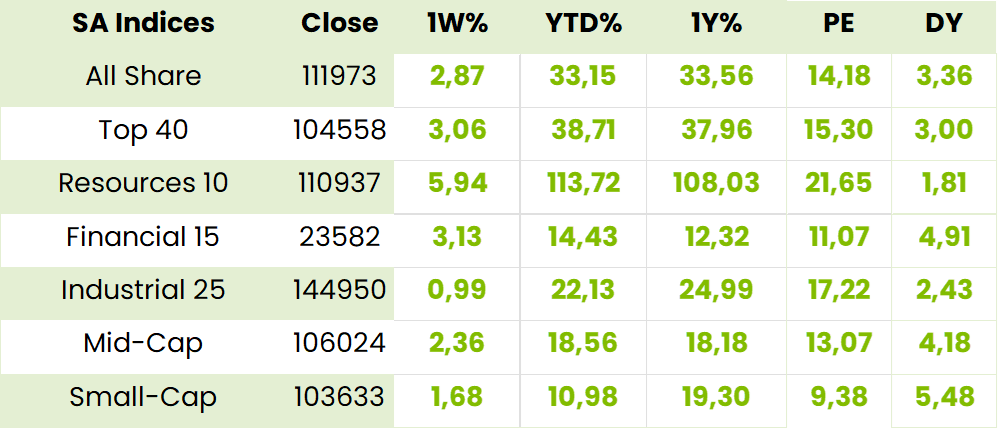
SA Indices
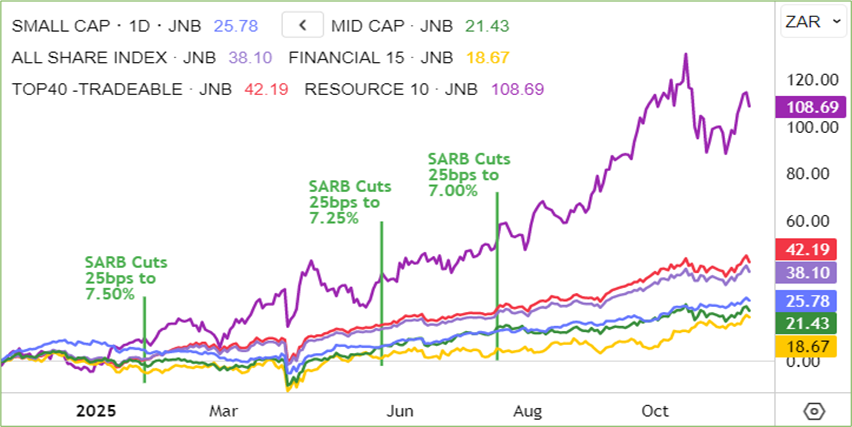
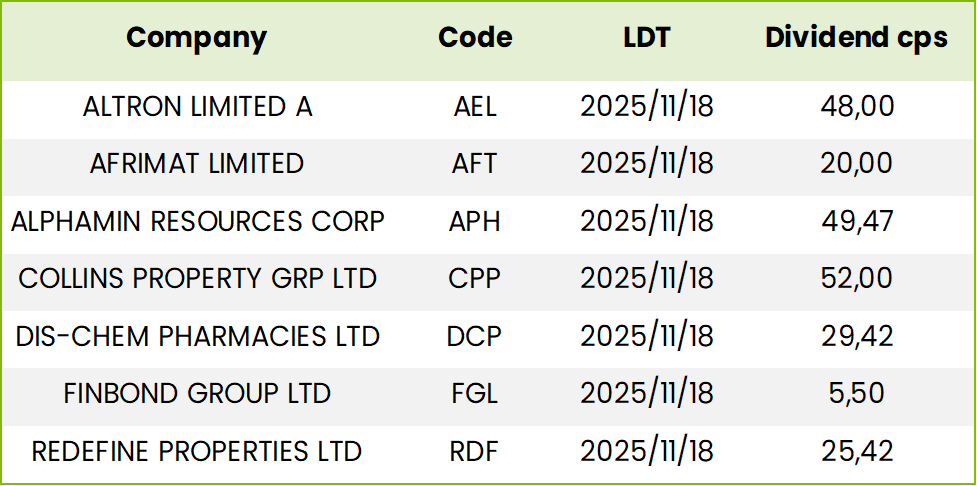
SA Upcoming Indicators & Dividends

SA Equity
Omnia (OMN) Financial Results for 1H of FY03/26 (7651c)

HEPS: 326cps (↑12.8% from 289cps)
EPS: 320cps (↑11.1% from 288cps)
Operating Profit: R1.03bn (↑12.2% from R918m)
Revenue: R11.22bn (↑2.6% from R10.93bn)
EBITDA: R1.18bn (↑7.3% from R1.10bn)
HEPS and EPS rose over 10% due to higher volumes across agriculture and mining, supported by agile operations and strategic inventory management. Operating profit and EBITDA growth reflect disciplined capital allocation and supply chain resilience.
Agriculture
Revenue rose 11% to R5.66bn, operating profit up 9% to R458m. Strong volumes in South Africa and Rest of Africa offset droughts in Australia and Brazil. Bio stimulant exports and US/Brazil distribution expansion gained traction.
Mining
Revenue increased 3% to R4.85bn, operating profit surged 7% to R570m. Growth in SADC and uranium sales in Namibia supported performance. Canada detonator plant commissioning and Indonesia metals diversification progressed. West Africa faced political instability.
Chemicals
Revenue fell 38% to R714m, operating loss widened to R22m. Subdued South African manufacturing and coatings demand impacted results. Water Care improved via new contracts. Restructuring and asset disposals, including Water Care, targeted for H2 completion.
Comment: So, apart from the dispute with SARS over the 2014-1016 tax returns, “what can go wrong?” is about the only question that can be asked after digesting CEO Seelan Gobalsamy and CFO Stefan Serfontein’s consistent confidence that the company was well placed for growth in its core sectors of agriculture and mining. The short answer to which is not much! With the initial costs of downsizing the chemicals division in the rear view mirror the gradual selling of unwanted components will add to the no debt and R700 cash pile which promises to grow further as good rains bode well for 2H 26. Having maintained supplies to customers during the 90-day OEM plant maintenance shut through extensive storage (including its fleet of 120 tankers) further benefits will accrue from the rejuvenated plant. Return on Equity, which has risen from 5.8% excluding chemicals in FY21 to 14.3% in 1H26 looks like ending FY26 at a long term high. Bearing in mind, internationally, explosives companies such as Enaux, EPC and DYNO trade on EV/Ebitda ratios of between 8.9x and 11.4x this bodes well for potential re-rating of Omnia on 4.9x. The CEO is confident that Omnia has not only the cash to expand locally and abroad but to do share buy backs (5.7m were bought at R55ps) or special dividends where appropriate. BUY

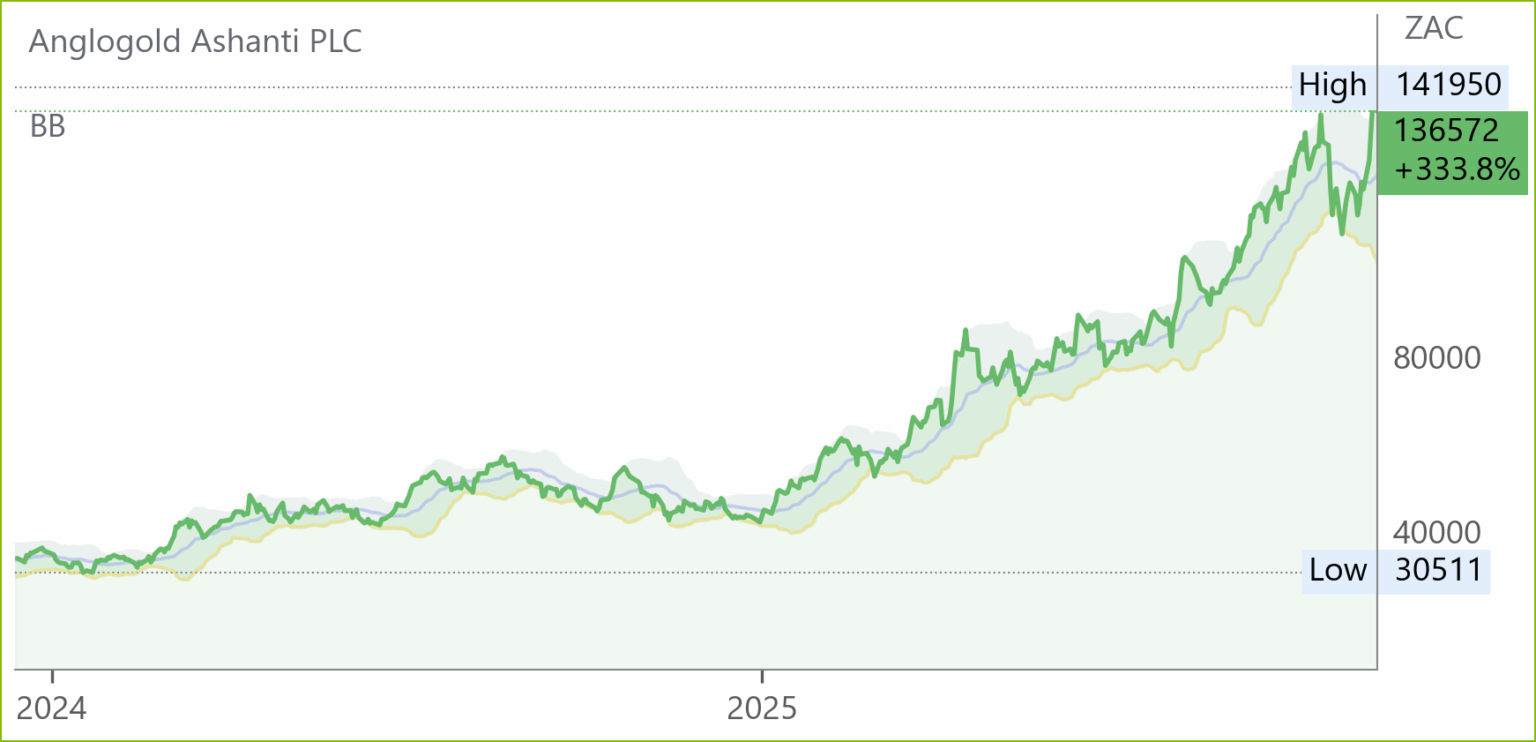
AngloGold Ashanti (ANG) Interim Results for 9M Sep 25 (136572c)
HEPS: 346c (↑166.2%)
EPS: 350c (↑175.6%)
Operating Profit: $2.83bn (↑190.6% from $974m)
Revenue: $6.71bn (↑69.5% from $3.96bn)
Gross Profit: $3.23bn (↑150.2% from $1.29bn)
EBITDA: $4.12bn (↑121.1% from $1.86bn)
Dividend: 183.5cps (interim dividend)
HEPS and EPS surged due to a 40% increase in the average gold price received ($3,222/oz vs $2,298/oz), improved production volumes, and cost discipline. Operating profit and EBITDA more than doubled, reflecting strong price pass-through and margin expansion.
Gold production rose 17% y/y to 768,000oz in Q3, driven by Obuasi (+30%), Kibali (+21%), and the inclusion of Sukari (Egypt). Free cash flow reached a record $920m in Q3, with net cash of $450m and total liquidity of $3.9bn. Sustaining capex rose 24% to $281m, supporting asset integrity and long-term resilience. The Augusta Gold acquisition in Nevada was completed, consolidating the Beatty District.
Annual guidance was reaffirmed. Strategic priorities include reserve growth, operational flexibility, and disciplined capital allocation. A feasibility study at Geita could lift output to 600,000oz/year for a decade. “This is another record quarter for cash generation and another healthy dividend declaration,” – Alberto Calderon, CEO.
Comment: CEO Alberto Calderon pointed out that, with abundant scope for increasing production, as well as reserves with ongoing exploration, there was no need for acquisitions. He also pointed out that Anglogold Ashanti (ANG) had, since 2Q 21, bucked the industry trend for above inflationary cost increases with relatively flat costs as against 19% up for its peers. While a decision to buy one of the world’s best gold mining operations is a call on the gold price, at current levels thereof, holders will still enjoy some DIVIDEND GROWTH.

Richemont (CFR) Interim Results for 6M Sep 25 (365833c)

HEPS: 6204.87cps (up 10% from 5662.94cps)
EPS: 6364.07cps (up 311% from 1547.33cps)
Operating Profit: ZAR 48,754m (up 11% from ZAR 43,818m)
Revenue: ZAR 219,558m (up 10% from ZAR 200,159m)
EPS rose 311% due to the disposal of Yoox Net-a-Porter (YNAP) and the non-recurrence of prior-year discontinued losses. HEPS excludes these one-off gains and losses, hence showing only a modest 10% increase.
Jewellery Maisons drove growth with double-digit regional increases. Specialist Watchmakers stabilised, while YNAP’s disposal to LuxExperience added €0.6bn cash inflow. Rand translation effects boosted reported ZAR growth. Cost discipline and digital investment reinforced resilience, with strong liquidity maintained at €6.5bn.
Richemont expects continued Jewellery-led growth and Watches stabilisation. “Richemont is advancing its strategy with confidence, focusing on sustainable growth, shareholder value creation, and reinforcing our Maisons’ global leadership.” – Johann Rupert, Chairperson.
Comment: these results indicate that the sudden funk causing Chinese luxury goods sales to contract by 18-20% in 2024 still made for soft sales with, however, a noticeable recovery in 2Q. Sales in developed markets continued at healthy levels aided no doubt by the buoyant equity markets. Swiss private business representatives have just visited Washington following the unsuccessful efforts of the Swiss president in her talks with Trump who has since indicated that he will reduce the 39% duty on Swiss imports “a little”. Chairman Johann Rupert says” recovery paths remain unsteady, for instance in China, and external pressures show no sign of abating.” The share price has reacted favourably to these results which were better than expected but we believe the share is FULLY VALUED for now.

Sanlam (SLM) Financial Results for FY24 (9483c)

HEPS: 854.1c (↑17% from 730c)
EPS: 854.1c (↑17% from 730c)
Operating Profit: R10.3bn (↓3% from R10.6bn)
Sanlam delivered solid growth across its diversified portfolio. Life insurance saw improved margins in South Africa and Pan-Africa, while general insurance benefited from lower claims and strong motor book sales in India. Investment management posted healthy inflows, and credit and structuring grew via Shriram Finance and South African bond structuring. The group adopted IFRS17-aligned metrics ahead of FY26 and maintained solvency ratios well above targets. Comment: Sanlam is on track to achieve its ambitious growth targets to 2030 outlined in the recent Capital Markets Day which include ROE >20%, Dividend growth CPI+4%, Op. profit growth CPI +,6%, doubling earnings between 2014 and 2030 implying a 12.25% CAGR. It is also highlighting the merits of its main growth engines not least of which are the Pan Africa JV with Allianz and the blossoming of its Shriram investment in India on both the Life and General insurance sides. Has had a good run and may well pull back but investors can safely ACCUMULATE for above average long term growth.

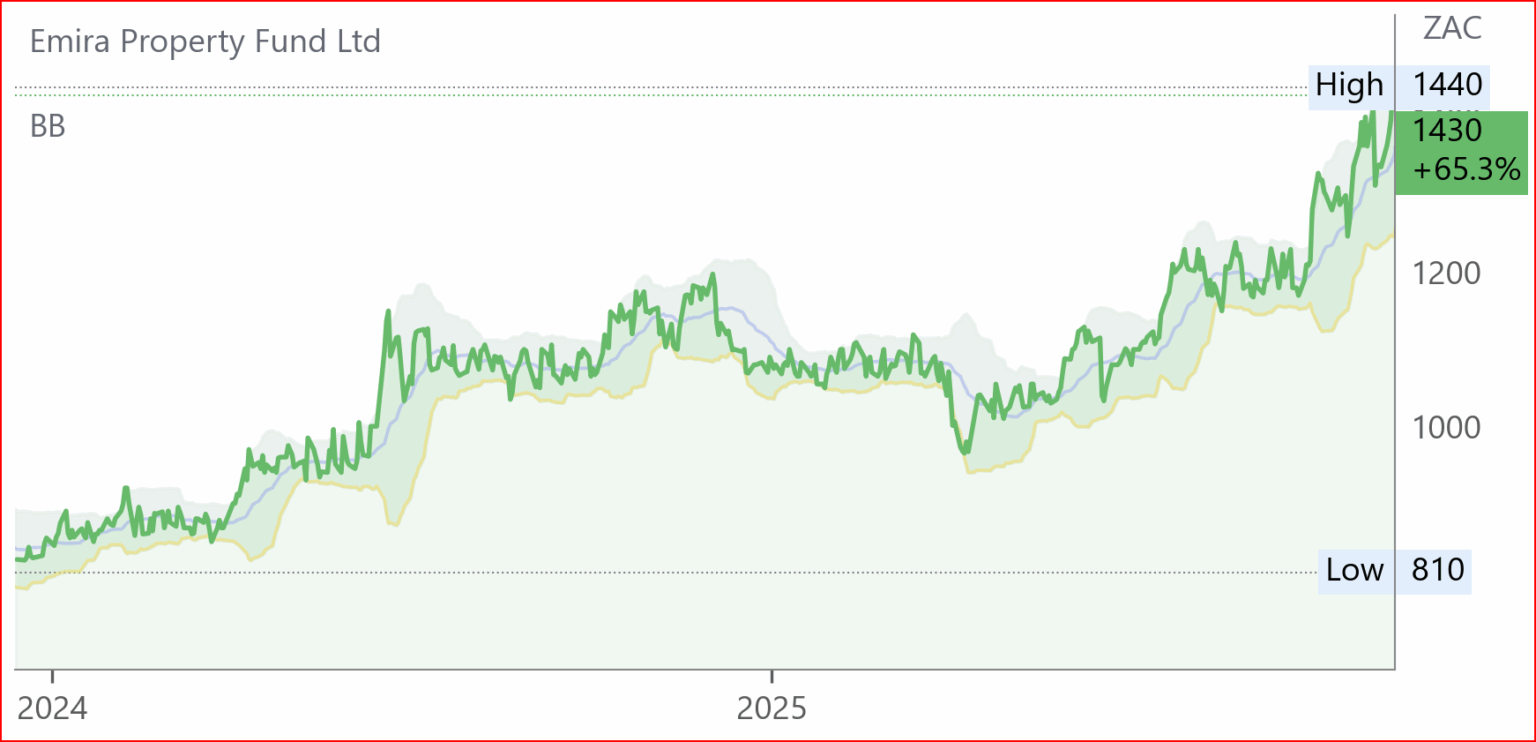
Emira (EMI) Interim Results for 6M Sep 25 (1430c)
HEPS: 64.83c (↑1.9% from 63.61c)
EPS: 98.55c (↓66.1% from 290.69c)
Revenue: R723.7m (↓22.1% from R928.7m)
Dividend: 64.40cps (interim dividend)
EPS declined sharply due to the absence of prior period fair value gains and lower property disposal proceeds. Revenue fell 22.1% as a result of reduced rental income from disposed assets. HEPS remained stable, supported by improved occupancy and cost containment.
Emira maintained a diversified portfolio across retail, industrial, office, and residential sectors in South Africa, with international exposure through equity interests in the US and Poland. Residential occupancy improved to 98.3%, and commercial vacancies declined to 3.8%. The Fund acquired a 6.4% stake in SA Corporate Real Estate and concluded property disposals worth R746.3m, with a further R405.7m pending transfer. US investment disposals totalled USD46.3m.
Loan-to-value improved to 35.6% from 36.3%. CEO James Day stated: “We continue to deliver sustainable income returns through a diversified portfolio and prudent balance sheet management.”
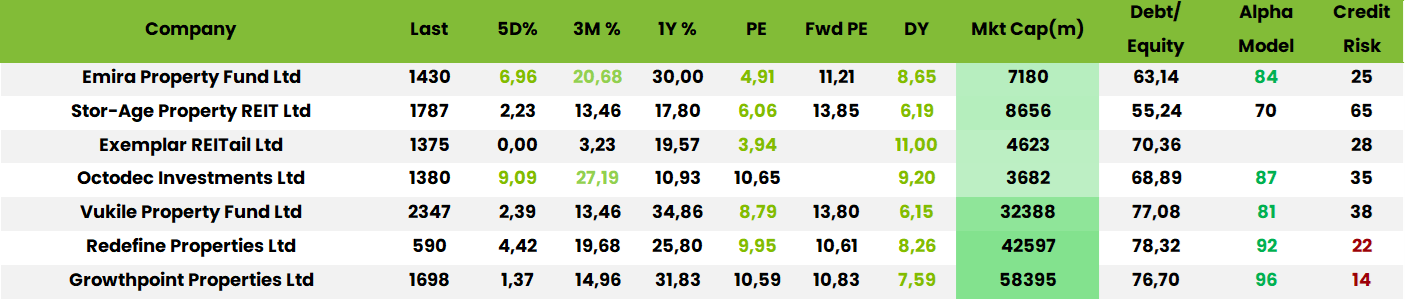
Comment: The stock has, in line with the sector had a good run, in recognition of satisfactory results and the opportunistically successful purchase of the SA Real Estate interest. The CFO was frank about the 23 % offices component remaining sticky and the CEO confirmed that US sales are in line with the active asset management strategy and do not presage withdrawal from the US. Taking into account the indirect assets in the US and Poland, the look through LTV is 55%. This strategy, which allows for gearing above the generally accepted sector limit of 40%, has been working well but, right now, the stock looks FULLY VALUED.
Stor-Age (SSS) Interim Results for 6M Sep 25 (1787c)

HEPS: 58.95c (↓57.8% from 139.85c)
EPS: 107.8c (↓40.6% from 181.46c)
Revenue: R699.1m (↑7.7% from R649.3m)
Dividend: 74cps (interim dividend)
HEPS declined due to the absence of prior period fair value gains and increased depreciation and finance costs linked to expansion activity. EPS was similarly impacted. Revenue growth was supported by rental income increases of 9.8% in SA and 2.5% in the UK, alongside occupancy gains.
Stor-Age expanded its footprint to 109 trading stores (63 SA; 46 UK), serving over 56,000 customers. Net investment property value rose 6.4% to R12.2bn. Key developments included the R95m acquisition of Lock-Up Storage in KZN, a new management contract in Exeter, and construction starts at Bramley and Chelmsford. The JV portfolio added 15,800m² GLA, and the development pipeline now includes 19 properties. SA REIT NAV per share increased 6.9% y/y.
Management reaffirmed FY26 guidance for distributable income per share to grow 5–6%, maintaining a 90% payout ratio. SA outlook is buoyed by improving macro conditions and potential rate cuts, while UK operations face sector-wide challenges. “We remain focused on operational efficiencies and scaling our third-party platform,” – GM Lucas, CEO.
Comment: Stor-Age is maintaining its FY 26 EPS growth forecast despite continuing to grow its Portfolio in its niche market in both the UK and SA. This bodes well for improved payout growth as well as diversification (UK 51.8% of portfolio value and SA 48.2%) but there is better value to be obtained elsewhere in the sector.
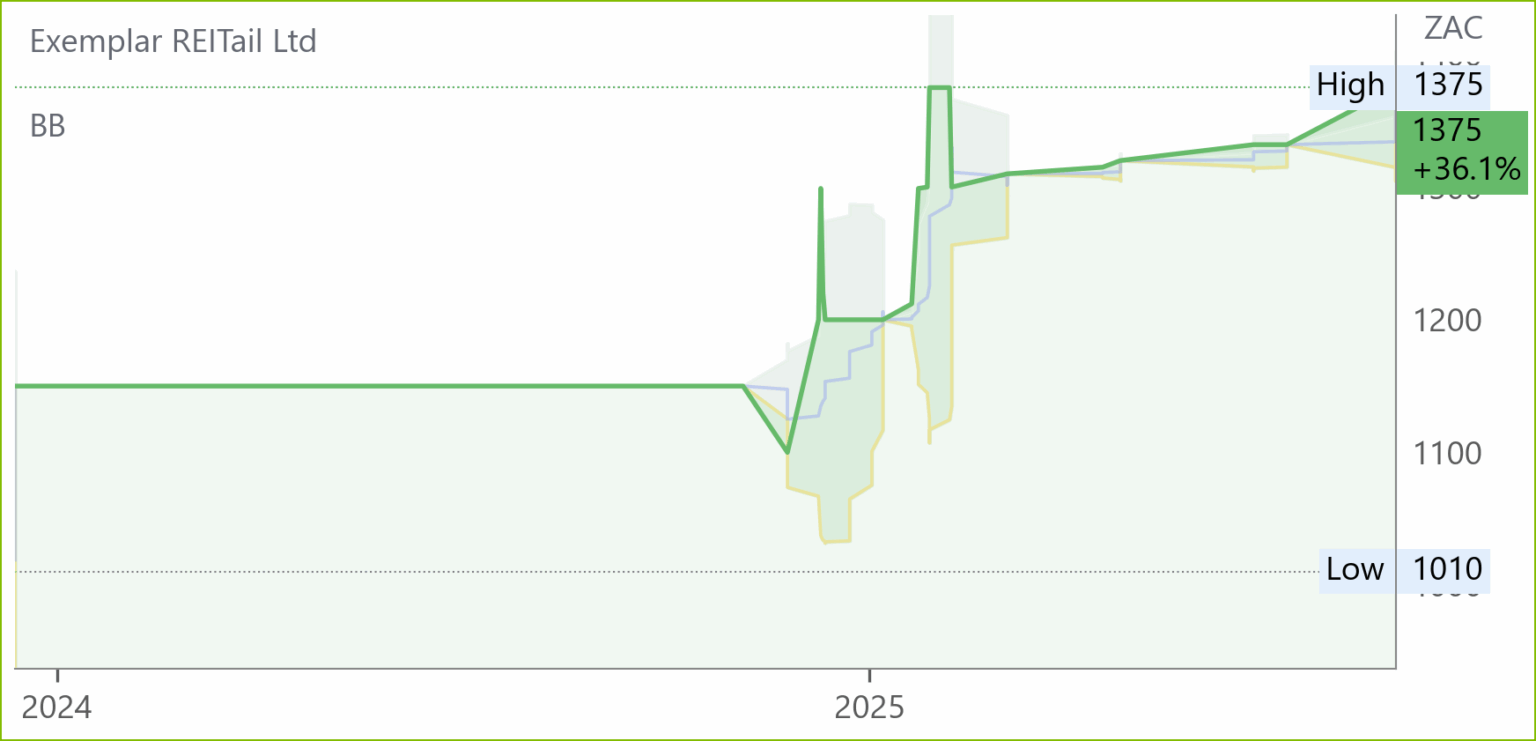
Exemplar (EXP) Interim Results for 6M Aug 25 (1375c)
HEPS: 73.46cps (↑17.6% from 62.47cps)
EPS: 126.24cps (↑12.7% from 111.99cps)
Revenue: R744.6m (↑16.6% from R638.5m)
Interim Dividend: 84.93cps (↑20.9% from 70.25cps)
HEPS and EPS rose strongly due to higher rental income, cost discipline, and improved portfolio performance. Revenue increased 16.6% as rural and township retail centres delivered resilient growth. Dividend uplift reflects confidence in cash generation.
Exemplar owns 28 retail assets across six provinces, with a combined GLA of 457,830m². It remains the only South African REIT focused exclusively on rural and township retail. The portfolio benefits from high footfall, defensive tenant mix, and community integration. The interim dividend qualifies as a REIT distribution under section 25BB of the Income Tax Act, with specific tax treatment for resident and non-resident shareholders.
CEO Jason McCormick stated: “We continue to deliver sustainable dividend growth by focusing on under-serviced markets and maintaining cost efficiency.” The company remains committed to disciplined capital allocation and long-term value creation.
Brait (BAT) Financial Results for 6M Sep 25 (215c)

HEPS: 12c (↓69.2% from 39c)
EPS: 12c (↓69.2% from 39c)
HEPS and EPS declined by over 50% due to a high base in the prior period and lower fair value adjustments on investments. The prior period included stronger earnings from Premier and Virgin Active, while current period valuations were more subdued.
Virgin Active, comprising 59% of total assets, delivered strong revenue growth across all territories, with LTM EBITDA up 45% to £112m. Premier, 37% of assets, grew revenue 6.4% and EBITDA 13.6% YoY, driven by MillBake and international divisions. New Look, 3% of assets, saw revenue decline 2% but EBITDA rose 34% to £21m due to restructuring. Brait repurchased £10m of convertible bonds and reported NAV per share of R3.21, up 5% from FY25.
CEO Kobus Gertenbach described the deal as “transformational: “Together we’ll have greater scale, stronger brand presence, and an exciting platform for sustainable growth.”
Comment: we note with interest that a deadline for the listing of Virgin Active has been set which brings forward the day on which the 34% discount will finally be closed and value unlocked. We would, however, take a chance on awaiting the announcement, rather than buying now.

Foschini (TFG) Interim Results for 6M Sep 25 (8622c)

HEPS: 292.6c (↓21.3% from 371.6c)
EPS: 290.8c (↓21.0% from 368.1c)
Operating Profit: R2.3bn (↓9.9% from R2.6bn)
Revenue: R31.4bn (↑12.2% from R28.0bn)
Gross Profit: R14.4bn (↑12.3% from R12.8bn)
Dividend: 130.0cps
HEPS and EPS declined over 20% due to margin compression and negative operating leverage, despite revenue growth. Operating profit fell nearly 10% as clearance markdowns and subdued discretionary spend pressured profitability.
TFG’s performance was shaped by weak macroeconomic conditions across South Africa, the UK, and Australia. Online sales surged 55.3%, now 14.7% of retail sales, boosted by the White Stuff acquisition. TFG Africa’s online growth of 40.2% was driven by Bash. Credit sales rose 7.9%, with the debtors book up 8.0% to R9.0bn. Store footprint adjusted with 93 openings and 94 closures, ending at 4,922 stores.
Outlook remains cautious amid inflationary pressures and low consumer confidence. TFG aims to leverage digital channels and maintain cost discipline. CEO A E Thunström stated: “We remain focused on operational resilience, prudent capital allocation, and leveraging our platform strengths to drive growth.”
Comment: management seems puzzled and even talks about gambling affecting consumer spend. Then there is Shein, although it is easing off, while OZ is not expecting any more interest rate cuts. Annualising 1H heps puts the stock on a 6 month FPE of c 14x but even Foschini can expect a somewhat better second half which could at, say, 450cps make for a FPE of c.11.6x which, while not a dripping roast, would induce some share price recovery. Although this is only a matter of time we think investors can await signs of a feistier festive season before accumulating.

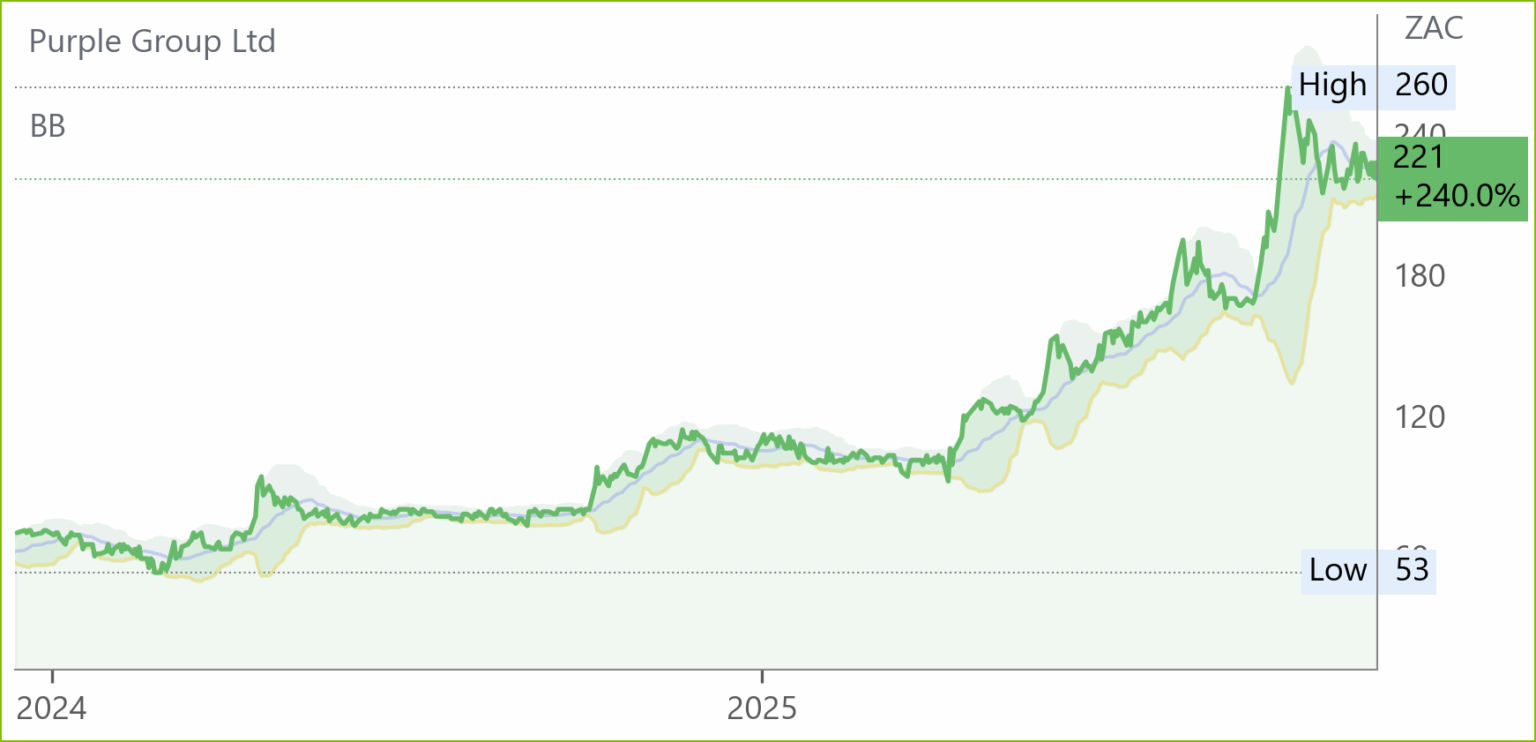
Purple (PPE) Financial Results for FY25 (221c)
HEPS: 4.30c (↑143.3% from 1.77c)
EPS: 4.30c (↑143.3% from 1.77c)
Operating Profit: R151.0m (↑52.4% from R99.0m)
Revenue: R486.7m (↑21.5% from R400.4m)
HEPS and EPS more than doubled due to operating leverage, disciplined cost control, and compounding client behaviours. Profit before tax rose 155.7% to R110.4m, driven by strong Easy platform performance. Retail revenue increased 32.2% and activity-based revenue rose 35.7%, supported by higher client engagement and asset growth.
Active clients grew 15.7% to 1.15 million, with client assets reaching R88bn. Retail inflows rose 48.2% to R11.12bn. October saw record deposits of R1.948bn and USD retail assets surpassed R10bn. Strategic initiatives included Thrive V3, EasyRetire scaling, embedded insurance, and advisor-led distribution. EasyTrader was integrated into the Easy ecosystem, enhancing user experience and retention. Net asset value per share rose 11.3% to 47.23c.
FY26 will focus on scaling core drivers, refining execution rhythm, and expanding into Kenya and the Philippines. CEO Charles Savage stated: “Each year the flywheel turns faster—this year faster still—clear evidence that participation and trust are compounding.” Purple aims to enter the JSE Top 40 by compounding distribution, ARPU, and client assets through embedded ecosystems and disciplined market expansion.
Comment: we believe there is a good possibility of this lofty forecast of the ever ebullient CEO being achieved but, on a 51.3x PE, we would await a better buying opportunity as the share price has also shown it is capable of downward volatility.

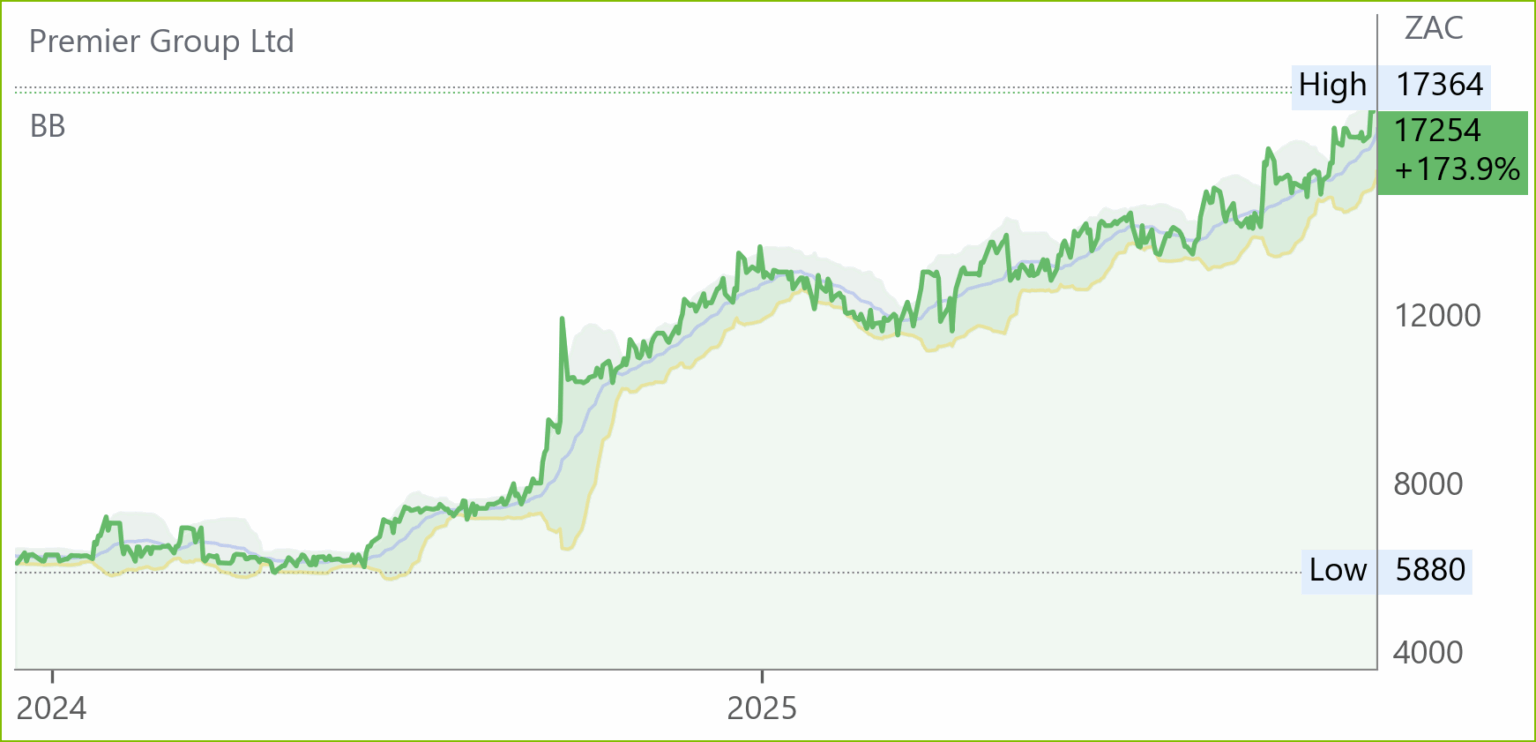
Premier (PMR) Interim Results for 6M Sep 25 (17254c)
HEPS: 560cps (↑27.9% from 438cps)
EPS: 558cps (↑27.4% from 438cps)
Operating Profit: R1.1bn (↑17.0% from R940m)
Revenue: R10.3bn (↑6.4% from R9.68bn)
EBITDA: R1.3bn (↑13.6% from R1.15bn)
Dividend: 159cps interim dividend
HEPS and EPS rose over 27% due to improved operational efficiency, cost containment, and volume growth across core divisions. EBITDA and operating profit growth reflect margin expansion and enhanced logistics execution. Revenue growth was moderate due to deflation in global grain prices.
Premier’s Millbake division, contributing 83% of revenue, grew 6% to R8.6bn, with EBITDA up 12.4% to R1.3bn. Volume growth of 4% and price/mix uplift of 2% supported performance. Groceries and International revenue rose 8.1% to R1.8bn, with EBITDA up 13.8% to R119m. The Aeroton mega-bakery commissioning remains on track, while tampon and liner machinery upgrades boosted local manufacturing and export capability.
Premier announced its intention to acquire RFG (Rhodes) via a share-swap deal, adding R8bn in annual revenue and R1.1bn in EBITDA. The combined entity will become the second-largest food producer on the JSE – RFG retains 22.5% of the enlarged group. Brands like Blue Ribbon, Snowflake, Iwisa, Rhodes Quality, and Bull Brand will form a diversified portfolio. Free float will rise from 33% to 40%, improving liquidity and institutional access.
Comment: On a trailing PE of 14.8x Premier Group (PMR) can still be bought despite its apparently heady run. In addition to the Rhodes deal which would add R8bn to the current R22bn market cap (and signify “here we come again” after decades of MIA) to sector leader Tiger Brands at R58bn). The deal, which is likely to be approved by the competition authorities, is earnings accretive, the product portfolios are complementary and the management teams will be integrated.
There are, however, many other growth vectors not least of which is the imminent completion of the Aeroton mega bakery which will “meaningfully enhance efficiencies and economies of scale “and so fundamentally improve the quality of the bread offered to consumers in the inland region. The marked deflation in grain prices (it has rained and the maize price is down 24%) will not only benefit and encourage consumers but shareholders as well. While investors CAN BUY NOW, they should also keep an eye out for the Share Buy back at R154 ps which might (in the depths of the upcoming holiday season perhaps) lead to some price weakness-apparently some large investors want to exit.

Operating Updates & Trading Statements
Harmony Gold (HAR) Operational Update for Q1 Sep 25 (7134c)
Revenue rose 20% due to a 34% increase in the average gold price received to R1,818,510/kg (US$3,209/oz), up from R1,360,974/kg (US$2,356/oz). Hidden Valley’s recovered grades improved 31% to 1.63g/t, boosting adjusted free cash flow by 115% to R1.7bn.
Harmony completed the acquisition of MAC Copper, adding immediate copper production from the CSA mine in Australia. Underground recovered grades decreased 6% to 5.91g/t, but remained above guidance. A 100MW solar plant at Moab Khotsong and a reverse osmosis water treatment plant at Tau Tona were commissioned, supporting long-term sustainability goals.
Harmony remains on track to meet FY26 guidance of 1.4Moz–1.5Moz gold production and AISC of R1,150,000–R1,220,000/kg. CEO Beyers Nel reaffirmed strategic focus: “Safe mines are profitable mines… Harmony is on track to meet its FY26 production, cost and grade guidance.” Copper production is expected to reach 100kt annually within 3–5 years, enhancing margin resilience and supporting energy transition goals.
Santam (SNT) Operational Update for 9M Sep 25 (38950c)
Santam delivered strong performance across key metrics, with double-digit growth in gross written and net earned premiums. Underwriting margin remained above the 5–10% target range, supported by favourable claims experience and improved rating strength. Annualised return on capital exceeded 30%, reflecting robust profitability across conventional and alternative risk transfer segments.
MiWay and Santam Re posted solid growth, while personal lines and business insurance accelerated post-Jun 25. Broker and Partner Solutions maintained momentum. ART segment delivered excellent fee and investment margin growth. Investment returns on capital portfolios were impacted by Rand strength, particularly foreign currency translation losses on Shriram General Insurance. Santam issued R2bn in subordinated debt in Oct 25 to optimise capital structure.
Final approval for the planned Santam Syndicate at Lloyd’s is expected by year-end. The initiative aims to enhance international growth and diversification, leveraging Santam’s specialist insurance expertise.
Tiger Brands (TBS) Trading Statement for FY25 (34450c)
HEPS: 1991–2081cps (↑10%–15% from 1810cps)
EPS: 2428–2525cps (↑25%–30% from 1942cps)
EPS rose up to 30% due to profits from the sale of Carozzi and the baby wellbeing division. HEPS increased 10%–15% on the back of volume recovery, margin expansion, and continuous improvement initiatives across core business units.
Tiger Brands expects a strong FY25 performance, driven by volume growth in Milling and Baking, Grains, and Home Care. Operating margins improved due to value engineering, factory efficiencies, and logistics optimisation. Portfolio optimisation progressed with the sale of Langeberg and Ashton Foods, and the Randfontein operations are pending Competition Commission approval. Chococam was classified as discontinued following a signed SPA with Minkama Capital and BGFI Bank. Results due 26 Nov ’25
Shoprite (SHP) Operational Update for Q1 FY26 (27500c)
Group sales for Q1 FY26 rose 8.0% year-on-year, with Supermarkets RSA up 7.9% and Non-RSA up 12.9%. Selling price inflation in RSA supermarkets fell to 1.4% (from 2.6%), with Shoprite the Aeroton megabakery which will and Usave banners recording 0% and -0.4% respectively. This reflects strong price leadership and cost vigilance.
Shoprite opened a net 81 stores, including 38 supermarkets, 22 Liquor Shops, and 19 adjacent formats such as Petshop Science and Uniq. Medirite grew sales 12.3%, now operating 139 dispensaries. Transpharm rose 2.7% despite relocation disruption. The OK Franchise network expanded to 618 stores. The sale of non-RSA furniture operations concluded on 1 Oct ’25, with RSA furniture sale pending regulatory approval.
CEO Pieter Engelbrecht stated: “We remain focused on delivering low prices through efficiency and innovation while expanding our ecosystem.” The group continues to outperform market growth by 1.7x (NielsenIQ), with low inflation and volume-led growth supporting momentum. Interim results expected Mar ’26.
Woolworths (WHL) Trading Statement for 19W to 9 Nov 25 (5378c)
Sales growth across all segments was achieved despite macroeconomic constraints in South Africa and Australia. Woolworths South Africa saw turnover and concession sales rise 7.4%, with Food up 7.7% and FBH up 6.2%. Woolies Dash expanded 24.2%, and online sales now contribute 7.3% to Food and 6.0% to FBH. Beauty and Home grew 9.6% and 13.8% respectively. CRG delivered 3.3% growth, with all brands except Mimco outperforming the prior period. A share buyback programme commenced in Sep ’25, with 6.9 million shares repurchased at an average price of R51.22.
Value chain transformation and digital investment are expected to sustain growth. CRG restructuring is yielding results, though promotional intensity in Australia persists. Woolworths Financial Services continues to focus on quality credit growth, maintaining a sector-leading impairment rate of 6.7. Results due mid-Jan ’26.
Octodec (OCT) Trading Statement for FY25 (101125c)
Dividend: 133.75c–136.25c per share
Distributable income per share (DIPS) is expected to rise 7.0%–9.0% to between 169.60c and 172.77c, driven by reduced expenditure, asset disposals, and active treasury management. This compares to 158.5c in FY24. Dividend per share (DPS) is projected to increase from 125c to between 133.75c and 136.25c, based on a minimum 75% payout ratio.
Octodec’s strategic focus on cost containment and portfolio optimisation supported distributable income growth. Asset disposals and treasury initiatives enhanced liquidity and operational efficiency. The group remains committed to maintaining a resilient balance sheet and improving rental collections across its diversified property portfolio, which includes retail, residential, and commercial assets concentrated in Tshwane and Johannesburg.
CEO Jeffrey Wapnick stated: “We continue to unlock value through disciplined capital allocation and operational excellence, positioning Octodec for sustainable growth in a challenging macroeconomic environment.”
PPC (PPC) Operational Update for 10M FY25 (535c)
PPC confirmed continued progress in its turnaround strategy under CEO Matias Cardarelli, with improved operational execution and cost discipline supporting margin recovery. The “Awaken the Giant” plan remains central to restoring sustainable profitability.
Cement volumes improved in South Africa and Zimbabwe, with pricing discipline and cost optimisation driving margin expansion. The Western Cape RK3 plant construction is progressing, with commissioning expected in FY26. The company continues to de-risk its balance sheet, including foreign exchange hedging for dollar-based capital expenditure. Strategic personnel changes and operational streamlining have enhanced agility and execution.
CEO Matias Cardarelli stated: “We are repositioning PPC for long-term growth and sustainable profitability through disciplined execution and strategic focus.” The group remains committed to its turnaround journey, with further updates expected in the full-year results. RK3 commissioning and regional demand recovery are key drivers for FY26 performance.
Stefanutti Stocks (SSK) Trading Statement for 6M Aug 25 (485c)
– HEPS: 41.18c–46.86c (↑45%–65% from 28.40c)
– EPS: 42.35c–48.40c (↑40%–60% from 30.25c)
HEPS and EPS increased significantly due to improved performance from continuing operations, excluding discontinued entities held for sale. The prior period included lower earnings from core operations, while the current period reflects stronger project execution and margin recovery.
Stefanutti Stocks continued to classify SS-Construções (Mozambique) and Stefanutti Stocks Construction as held for sale. Results were split between continuing and discontinued operations in line with IFRS. Total operations delivered EPS of 28.81c–29.16c, up over 1,585% from 1.71c, and total HEPS of 33.08c–35.72c, up 150%–170% from 13.23c. The improvement reflects reduced losses from discontinued operations and stabilisation across core segments. Results Due 25 Nov.
RMB (RMH) Trading Statement FY25 (485c)
Net asset value (NAV) per share is expected to decline by 20%–36% from 66.0c to a range of 42.3c–52.7c as at 30 Sep ‘25.
The decrease is primarily due to an impairment recognised on RMH’s investment in Atterbury Property Holdings, following an IAS 36 assessment. This impairment reflects a lower recoverable amount than carrying value, but does not indicate deterioration in Atterbury’s operational performance.
RMH continues to benchmark performance against NAV per share. The impairment was triggered by market indicators during the reporting period and will be detailed in the reviewed condensed results for FY25. Results due 8 Dec ‘25.
Telkom (TKG) Trading Statement for H1 FY26 (3130c)
HEPS: 301.1–315.8cps (↑105%–115% from 146.9cps)
EPS: 311.8–329.1cps (↑80%–90% from 173.2cps)
HEPS and EPS more than doubled due to the absence of once-off costs in the prior period, including a R451m derecognition loss from the Telkom Retirement Fund and R117m in restructuring costs. Structural cost containment also supported earnings growth.
Telkom’s earnings rebound reflects improved operational discipline and the successful disposal of Swiftnet, previously classified as a discontinued operation. Continued focus on cost optimisation and core business performance contributed to the uplift. The difference between EPS and HEPS stems from asset disposal gains offset by write-offs. Interim results will provide further clarity on segmental performance and strategic progress. Results due 18 Nov ’25
Snippets
Delta Property (DLT) sold its entire 3% stake in Grit Real Estate Income Group for GBP 810,371.95 to Peresec Prime Brokers. The sale aligns with Delta’s strategy to divest non-core assets, reduce debt, and improve liquidity. Grit, a pan-African real estate firm, reported a USD 65.4 million loss and USD 344.4 million net asset value for FY2025.
Cell C (CCD) Listing Details and Rationale
– Offer opens: 13 Nov ’25 at 09:00
– Offer closes: 21 Nov ’25 at 12:00
– Allocations advised: 21 Nov ’25
– Final pricing and allocations on SENS: 24 Nov ’25
– Listing and settlement date: 27 Nov ’25
– Sponsor: Rand Merchant Bank (a division of FirstRand Bank Ltd)
Up to 173.4m shares, plus 9.52m additional shares, are offered, including 68m allocated to a new empowerment structure. Proceeds of R6.5bn target liquidity and growth as well as enabling BLU to partially monetise its investment. Market capitalisation is estimated at R10–12bn, with pricing between R29.50–R35.50.
It also allows investors to independently assess Cell C’s value and strategy. “The listing will elevate the Cell C brand, enhance access to capital, and instil public transparency and market discipline,” said Peter Hayward-Butt, CEO.
Combined Motor Holdings (CMH) announced a voluntary share repurchase of up to 11.22m shares (15% of issued capital) at R35.50 per share. Funded from surplus cash reserves, the buyback aims to enhance earnings and dividends per share. Repurchased shares will be cancelled and delisted on 17 Dec ’25, with payment due 15 Dec ’25
KAP (KAP) announced the disposal of Unitrans Swazi Holdings to Freight-X for R214m, including vehicles and net working capital. The transaction, effective 1 Dec ’25, follows restructuring to exit low-margin operations while retaining agricultural opportunities in Eswatini. Proceeds will fund asset replacement. The disposal results in a R39m loss.
The JSE (JSE) has been referred to the Competition Tribunal over alleged exclusionary practices linked to its broker dealer accounting system (BDA) and matched principal trade type, following a 2022 complaint by A2X. The JSE rejects the claim citing legal advice that they lack merit. A plea is expected in early 2026.
Sibanye Stillwater (SSW) will pay $215m to Appian Capital Advisory following the cancellation of its $1.2bn deal to acquire Brazilian mines in 2022. The settlement avoids further legal costs after London’s High Court ordered compensation. Both parties welcomed the resolution and will now refocus on core operations.