Finova Investor Digest
Global Indices, Currencies, Crypto & Commodities
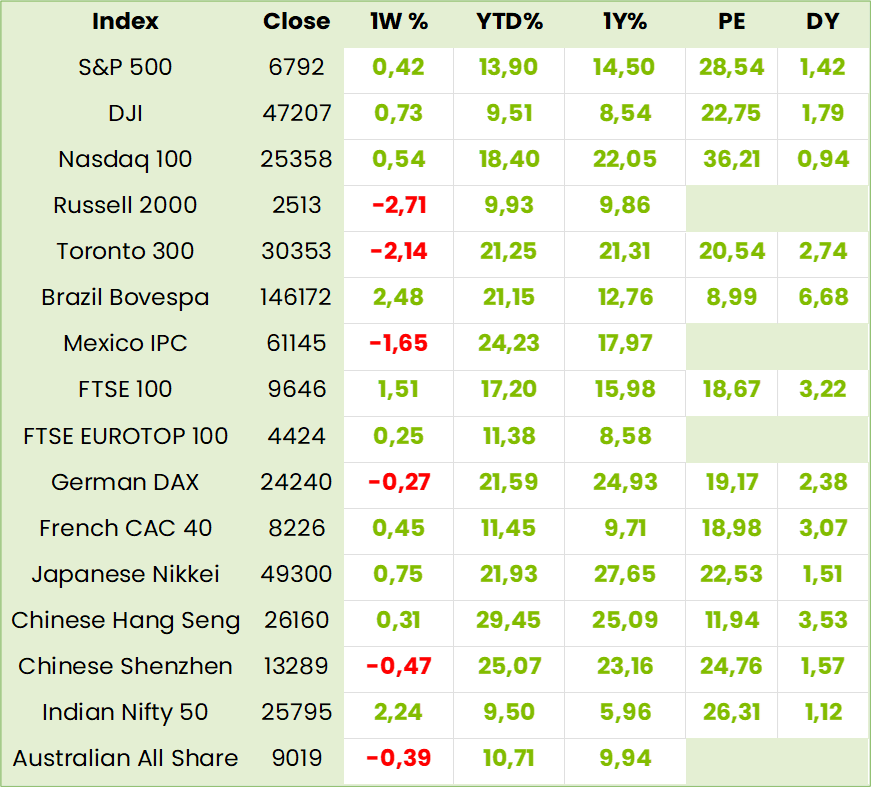
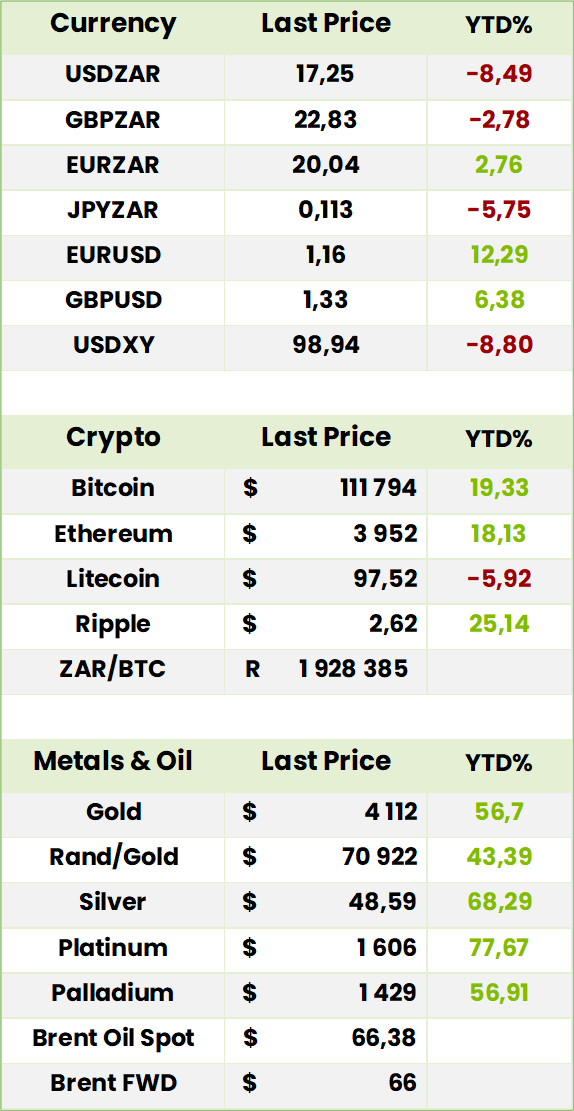
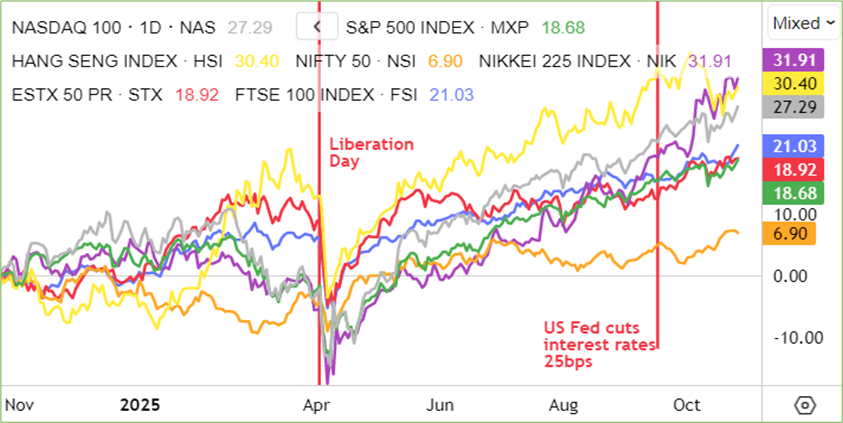
Global Indices 1 year to Date
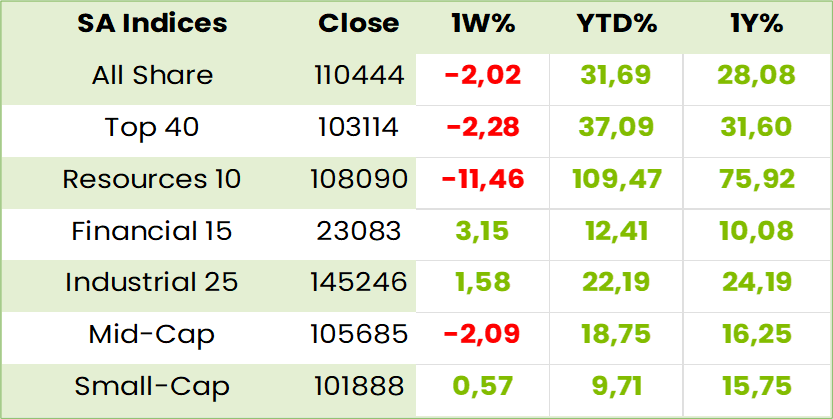
SA Indices

SA Upcoming Indicators & Dividends

SA Equity
Proposed JSE Listing- Optasia (OPA) AI-powered fintech platform
Optasia is raising ZAR1.3bn(~$75m) in a Primary Issuance (new shares): for growth and offer Secondary shares of: ≥ZAR5.0bn (~$300m) by existing holders
Total Offer: Up to ZAR6.3bn (~$375m)
This is expected to the largest listing of the year in the high growth Tech Sector.
Shares Offered: Up to 419.8m (30.4% of capital) at a Price Range: ZAR15.50–ZAR19.00
Sector: Finance & Credit Services – Consumer Lending
To apply participate please confirm your application with us by close of business on 27 October 2025.
Minimum Application is R10 000
Listing Date: 3 Nov 2025
Company Overview
AI-driven fintech offering Micro Financing and Airtime Credit Solutions across 38 countries. Serves 121M monthly users via 49 MNOs (e.g. MTN, Airtel) and 13 financial institutions.
Their “Tech Edge”: AI engine generates 100K+ features per customer for credit decisions. The fintech uses proprietary AI to assess creditworthiness in emerging markets, leveraging unstructured data where formal banking is absent. It partners with mobile platforms like M-Pesa and MoMo to reach underserved populations, disbursing microloans via licensed institutions. CEO Salvador Anglada says a third of clients are small business owners.
Financial Highlights
– Revenue & EBITDA up ~90% YoY (H1 2025); ~$23bn distributed since 2016;
– ~64bn credit decisions since inception
Strategic Goals
– Fund growth and acquisitions; Enhance liquidity and visibility; Partial exit for current shareholders; Support employee equity plans
Lock-Up Terms
– No new shares for 12 months post-listing and management a 365-day lock-up
Competitive Strengths
– Large emerging market reach through strong mobile network operators (MTN, Vodacom & Orange) complimented by financial institution integration
– Broad geographic footprint with scalable AI-led credit infrastructure
Comment: Microlending has come a long way since Nobel Peace Prize winner, Professor Muhammad Yunus, founded the Grameen bank in 1983 with a $27 loan to 42 women in a small Bangla Deshi village.
With Optasia’s success in the most underbanked area of the world, the potential appears to be enormous. While most Africans north of the Zambezi have mobile phones few have bank accounts. So, while Yunus’s “data” was the assessment by the villagers’ of their peers’ credit worthiness, Optasia gleans over 100,000 features per phone owner to assess them with remarkable accuracy.
FNB has issued the following report – Optasia – Divinely visionary? – which includes the following comment: “Optasia’s scale and growth trajectory in AI-driven financial services position the offer to be the largest fintech listing in South Africa for the year, with early indications that the offer will be oversubscribed. The implied market cap based on the offer price range is R19.4 billion to R23.5 billion. This translates to a blended 12-month forward PE of 16.1 times at the bottom end and 19.4 times at the top end. Given the high expected near- and medium-term growth rate, we are comfortable applying at market.
The risk embedded in this business is regarded as quite high, however, with the success of the growth strategy hinging on leadership’s ability to manage defaults, currency swings, and compliance complexities and costs.”
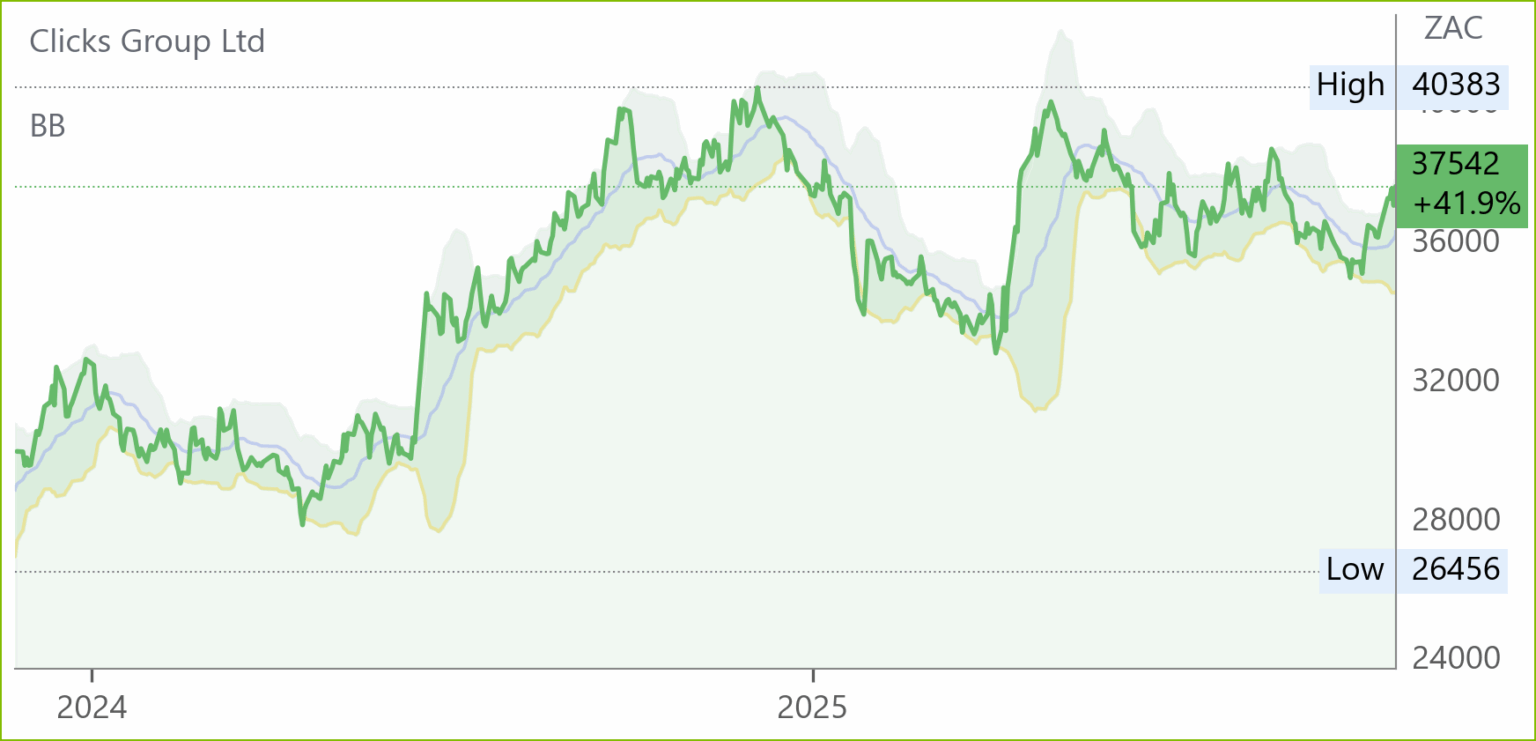
Clicks (CLS) Financial Results for FY25 (37542c)
HEPS: 1362c (↑14.1% from FY24)
EPS: 1363c (↑14.5% from FY24)
Operating Profit: R4.7bn (↑12.1% from FY24)
Revenue: R47.8bn (↑5.3% from FY24)
Dividend: 886c per share
HEPS and EPS rose strongly due to margin expansion in private label products and disciplined cost control. Operating profit grew on higher retail turnover and improved supply chain efficiency. Distribution margin declined slightly, offset by retail strength. Clicks expanded its store base to over 990 and pharmacy network to 780. Private label and exclusive brands contributed R9.7bn to turnover, growing 10.7%. ClubCard membership reached 12.6 million, contributing 82.6% of sales. R2.7bn was returned to shareholders via dividends and buybacks. Inventory levels rose due to new store openings and GLP-1 demand. Management remains confident in its defensive positioning. Plans include 40–50 new stores and pharmacies in FY26, with R1.26bn capex allocated. “We are well positioned in health and beauty, with market-leading shares and a strong omni-channel strategy.” – Bertina Engelbrecht, CEO.
Comment: with a Forward PE of 24.4x and 10 year HEPS CAGR of “only” 13.4% the resultant PEG ratio of 1.4x, which is well above the cautionary level of 1.0x demands a high level of confidence in its sustainability in order for the power of compound interest to work its magic for the investor. As it happens, however, there are too many reasons for such confidence to include in this space so we mention only a few. Clicks operates in the defensive areas of Health and Beauty with market shares of between 33.1% and 24.0 % as well as 43.8% and 23.1% respectively. It provides value to customers via its Cash Back, of R844m in FY25 to its 12.6m Clicks Club Card members as well as, to all customers, who benefit from its growing provision of private label products. In pharmacy generics grew 8.8% to 59% of sales while promotional sales grew 8.8 % to 47% of turnover. Clicks maintains a high ROE of c. 49% and a c.60% payout ratio. Exceptionally tight cost control is enhanced by extensive use of solar as well as EVs. Good relations with the Department of Health help it keep the growth of pharmacies up with Clicks stores. Management sees plenty of growth potential in SA as well as eventual expansion in Africa, albeit with appropriate business model changes.

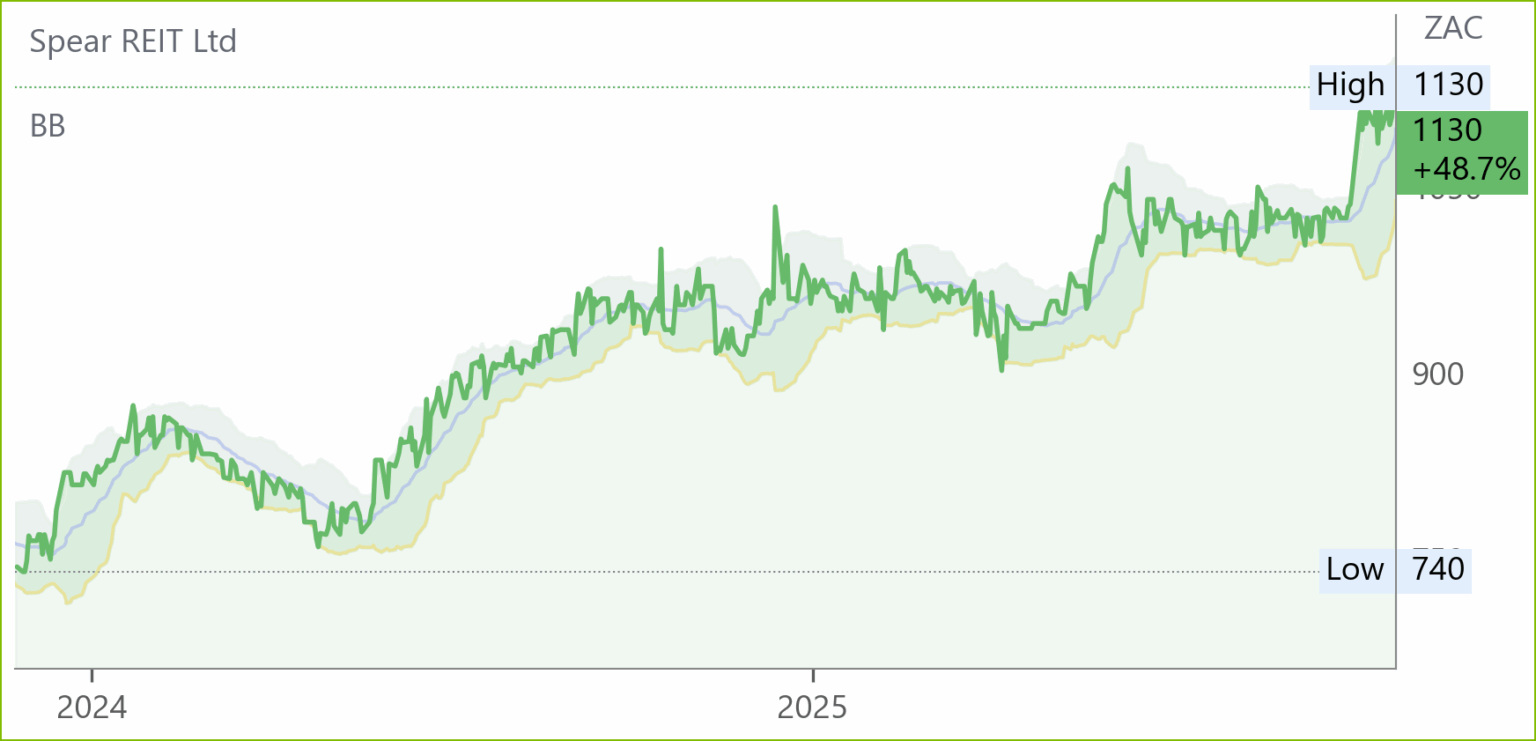
Spear (SEA) Interim Results for 6M to Aug ’25 (1130c)
HEPS: 43.33c (↑11.88% from 38.73c)
EPS: 73.96c (↑64.47% from 44.97c)
Revenue: R385.9m excl. smoothing (↑25.72% from R306.9m)
Dividend: 41.59cps
EPS surged 64.47% due to strong rental collections, increased letting activity, and strategic acquisitions. Revenue growth was driven by expansion in industrial and retail portfolios, with improved occupancy and escalations across sectors.
Spear remains the only regionally focused REIT on the JSE, investing exclusively in the Western Cape. During HY26, it acquired R1.074bn in assets at a 9.54% yield, expanded its industrial pipeline, and maintained 95.03% occupancy. Spear REIT’s acquisition of Consani Industrial Park has received unconditional approval from competition authorities. Transfer expected Dec ’25, enabling expansion of its Western Cape industrial portfolio and rental enterprise footprint. Retail and commercial segments showed resilience, with national tenants comprising 47.5% of retail mix.
Comment: what stands out amongst a commendable set of metrics is the exceptionally low loan to value (LTV) of 13.85% in a sector where many peers struggle to keep it below 40%. The reason is that, despite the R1.08bn assets acquisition at a yield in excess of its weighted average cost of capital, Spear also has R800M cash on hand and plans further acquisitions. Spear is focused on the Western Cape but the portfolio is diversified with industrial property valued at R2.2bn, commercial at R2.4bn and retail at R1bn. Although most properties are in the vicinity of Cape Town, the dynamism of the Western Cape stretches to George where Spear has commenced site civils work on the GTX Office Park adjacent to the Airport which is to be upgraded in 2026 and 2027. Expenditure of between R300m and R320m is anticipated over the next 5 years as tenants sign up for the opportunities in the Business Park. Spear’s market capitalization of c. R4.4bn is not in the league of Growthpoint and Redefine at R46bn and R32bn respectively and is below the likes of Fortress at c. 22bn and Attacq at c. R10bn but trade in the stock was a brisk 37m shares worth R371m in the first half. As Frans Cronje says, the Western Cape on its own is one of the world’s premier Emerging Market regions. This stock has the management and expertise to benefit accordingly and can safely be BOUGHT.

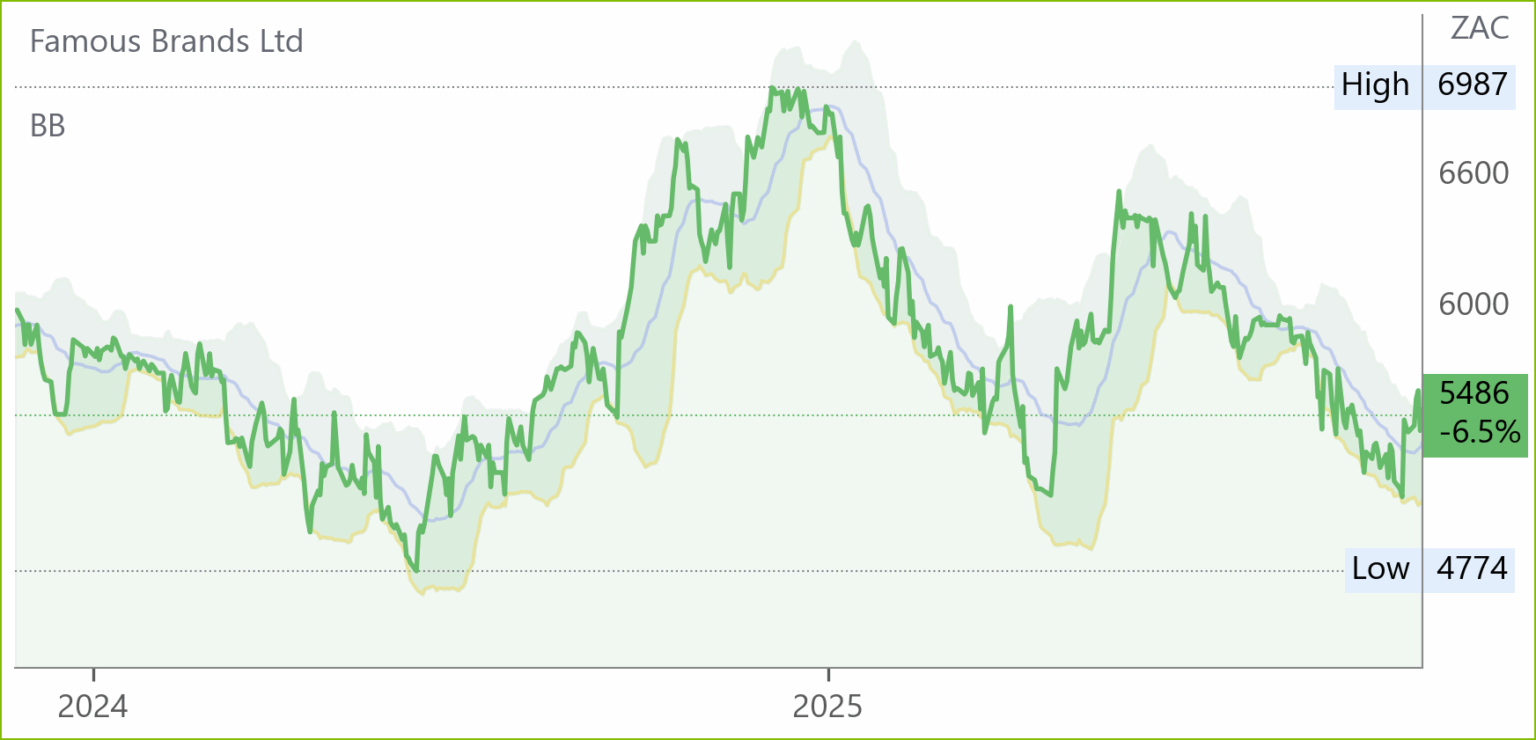
Famous Brands (FBR) Interim Results for 6M Aug 25 (5486c)
HEPS: 236cps (↑8.0% from 218cps)
EPS: 236cps (↑6.8% from 221cps)
Operating Profit: R393m (↑5.8% from R371m)
Revenue: R4.24bn (↑5.6% from R4.02bn)
Dividend: 162cps
HEPS and EPS rose due to strong QSR brand performance, improved manufacturing yields, and cost containment. Manufacturing EBIT rose 23.6%, offsetting logistics margin pressure and retail losses. Cold storage facility completion supported operational efficiency.
Restaurant footprint grew to 3 008 outlets across 20 countries. SA Leading Brands drove growth via value offerings and drive-thru expansion. Signature Brands underperformed amid weak premium dining demand. SADC delivered mixed results; AME and UK remained challenged by inflation and cautious consumer spend. Manufacturing and logistics showed resilience despite input cost pressures.
Comment: the 10 year share price performances of Famous Brands and its sector peer Spur says as much about the state of the SA economy as these stocks. At the outset of 2014 Famous Brands was c.9800c and is now c. 5450c while Spur was c. 3000 and, 10 years later, has merely managed to climb to c. 3500c. The above mentioned Clicks, operating in the defensive sectors of health and beauty, managed a more than sixfold increase in price from c. R60ps to R373. So patronising Quick Service Restaurants and dining out is not as necessary as your meds and beauty! Famous Brands management is, however, definitely cautiously optimistic that the green shoots it sees will benefit it in due course and we agree. Right now, we think it is a little early, but a strong festive season could be the signal for a little accumulation.

Afrimat (AFT) Interim Results for 6M Aug 25 (4437c)

HEPS: 101.9c (↑92.3% from 6M Aug 24)
EPS: 102.7c (↑76.2% from 6M Aug 24)
Operating Profit: R379.8m (↑29.8% from 6M Aug 24)
Revenue: R5.33bn (↑29.9% from 6M Aug 24)
Dividend: 20.0c per share
HEPS and EPS surged due to strong iron ore sales, Lafarge asset integration, and improved cement volumes. Operating profit rose on higher contribution from Bulk Commodities and Construction Materials, despite losses in cement and weaker Industrial Minerals.
Afrimat integrated Lafarge South Africa assets, regaining market share in aggregates and improving cement plant reliability. Iron ore volumes rose sharply, with domestic sales more than doubling. Anthracite exports resumed via Mozambique, while ferrochrome smelter closures impacted domestic demand. Fly-ash and readymix operations performed well. Future Materials segment showed promise in battery and magnet applications.
Management expects continued momentum from Lafarge assets and cement operations. Iron ore exports remain stable, though domestic volumes may soften due to AMSA’s Newcastle closure.
Comment: with the iron ore outlook at best stable and anthracite uncertain, the share price, on a 60x PE, is already discounting, albeit belatedly, ongoing recovery in Lafarge, both operationally and, with infrastructure spending picking up, offtake wise. There is no need to go big on the stock but some early buying now would not go unrewarded.

4Sight (4SI) Interim Results for 6M Aug 25 (77c)

HEPS: 6.753cps (↑30.2% from 5.185cps)
EPS: 6.754cps (↑30.3% from 5.184cps)
Operating Profit: R48.3m (↑35.7% from R35.6m)
Revenue: R578.7m (↑6.8% from R542.0m)
Gross Profit: R254.1m (↑15.3% from R220.4m)
HEPS and EPS rose over 30% due to strong operating leverage, improved sales mix, and margin expansion. Gross profit margin increased to 43.9% (from 40.7%) driven by a 10.4% rise in professional services revenue. Operating profit growth outpaced revenue due to cost discipline and cluster-level efficiencies.
AI-led transformation accelerated across clusters. The Business Environment Cluster posted a 264% profit surge, reflecting demand for data and AI solutions. The IT Cluster maintained momentum in ERP and HR automation. The Operational Technologies Cluster faced temporary pressure from mining sector softness but pivoted to oil and gas. Channel Partner profitability rose 14% on African market growth. Shared Services delivered cost savings via automation and role consolidation. The group is exploring acquisitions to scale revenue and IP, while leveraging its B-BBEE level 1 status to enhance market positioning.

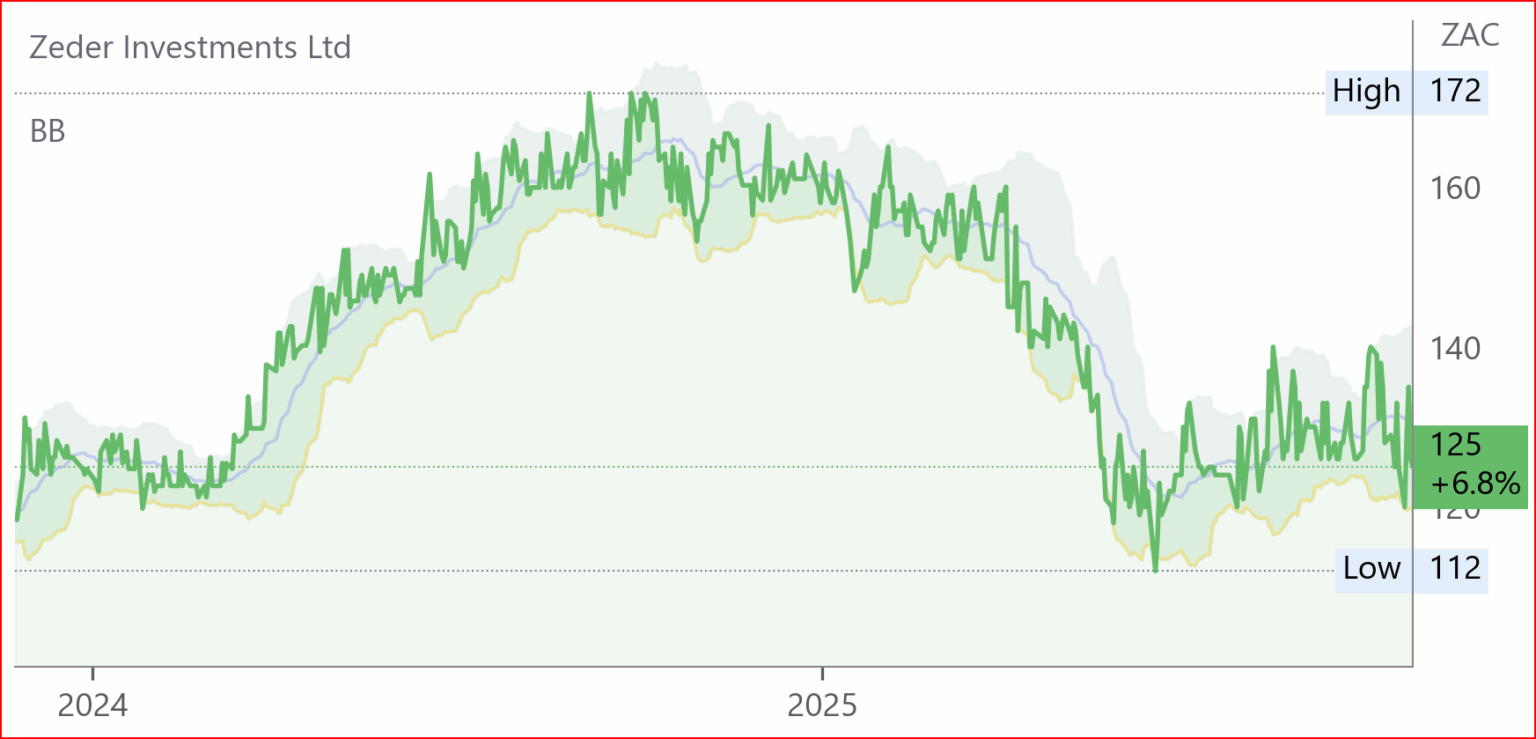
Zeder (ZED) Interim Results for 6M Aug 25 (125c)
HEPS: -10.0cps (↓143.9% from 4.1cps)
EPS: -10.0cps (↓143.9% from 4.1cps)
Operating Profit: -R147m (↓107.0% from -R71m)
Dividend: 31.0cps per share (61cps Total)
HEPS and EPS declined sharply due to downward revaluations of unlisted investments, which offset dividend income. The operating loss more than doubled, reflecting the impact of these valuation adjustments and a constrained macroeconomic environment.
Advanced negotiations are underway to dispose of Zaad’s operations in Zimbabwe, Mozambique, Zambia, and Angola, with combined consideration of R180m. These transactions include IP rights held in the Netherlands and are pending competition commission approval, expected by Nov 25. A special dividend of 31.0cps was paid earlier in the year, contributing to a 21.9% drop in NAV per share to R1.68. EA Seeds is gaining traction in Eastern Africa’s hybrid maize segment, while South African seed and chemical markets show renewed growth potential.

Vunani (VUN) Interim Results for 6M Aug 25 (200c)

HEPS: 9.5cps (↑41.8% from 6.7cps)
EPS: 9.5cps (↑41.8% from 6.7cps)
Revenue: R356.6m (↑8.8% from R327.8m)
HEPS and EPS rose over 40% due to improved profitability across fund management, insurance, and advisory services. Profit after tax increased to R24.7m, supported by higher premiums and stable cost control. Total comprehensive income reached R25.2m, up from R22.5m.
Vunani’s diversified segments—fund management, asset administration, insurance, and investment banking—contributed positively. Equity holders’ profit rose to R15.3m (↑41.7%). The group maintained momentum despite macroeconomic headwinds, with insurance and advisory services showing resilience.
Operating Updates & Trading Statements
Sasol (SOL) Business Update for Q1 FY26 (11426c)

EBITDA: Significantly ↑ vs Q1 FY25
Adjusted EBITDA rose significantly year-on-year, driven by improved unit margins and operational execution in International Chemicals. Southern Africa operations benefited from higher coal production and improved equipment availability.
Sasol reported improved production at Secunda and Natref, with higher fuels sales volumes and a growing mobility channel. Chemicals Africa volumes were flat, but revenue declined due to weaker pricing. International Chemicals saw stronger revenue and EBITDA, supported by higher US volumes and improved pricing in Eurasia.
Management reaffirmed FY26 guidance, with Southern Africa’s breakeven oil price at US$55–60/bbl and International Chemicals on track for US$450–550m adjusted EBITDA. Macro headwinds, including global tariff shifts, remain a risk.
Results due Feb ’26

Quilter (QLT) Prelim Results for FY24 (4079c)
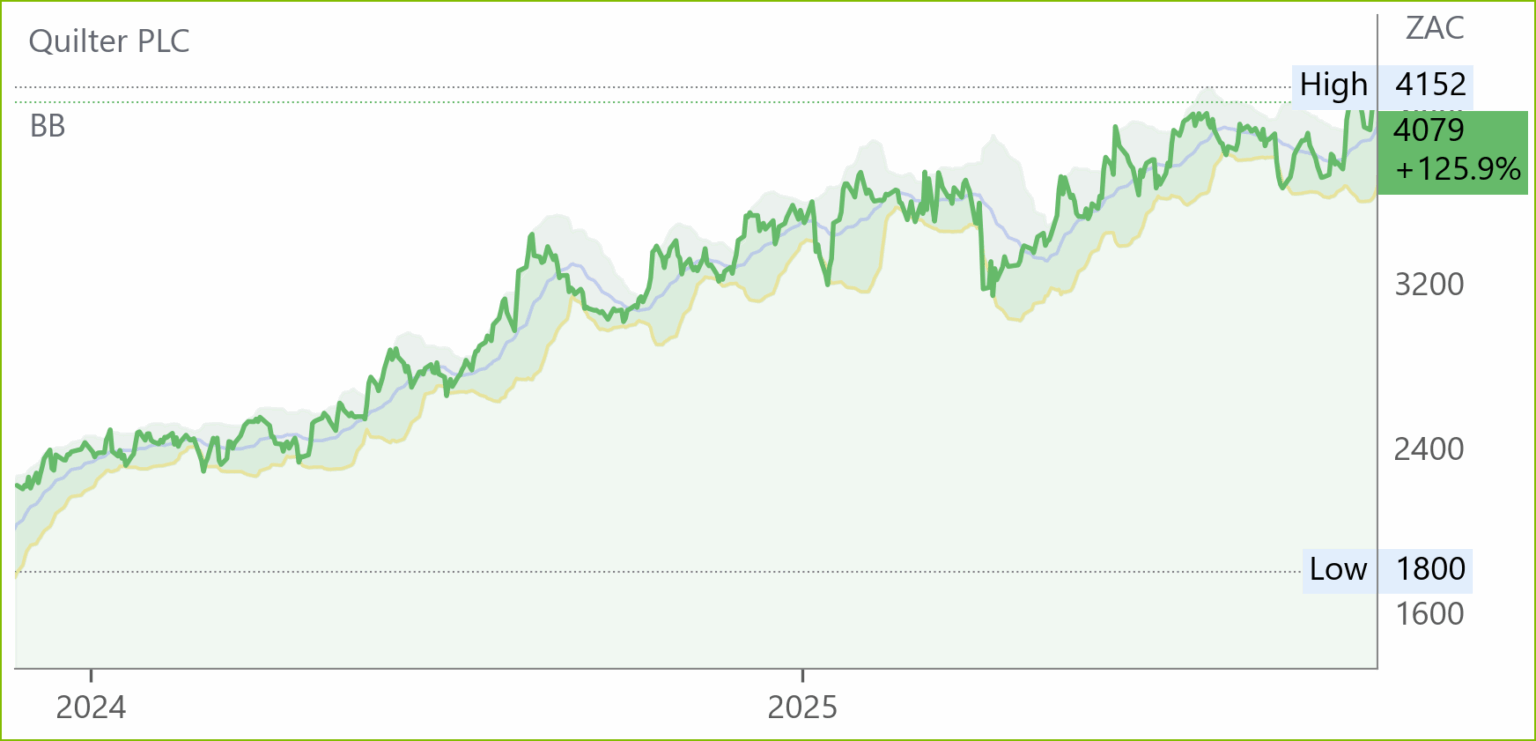
Quilter reported core net inflows of £6.7bn for the nine months to Sep ’25, already exceeding FY24’s full-year total of £5.2bn. Q3 net inflows of £2.2bn were up 48% YoY, driven by strong platform performance in the Affluent segment and stable High Net Worth flows. Assets under Management and Administration rose to £134.8bn, up 7% from Jun ’25, supported by £6.4bn in market uplift.
Affluent segment growth was led by IFA channel net inflows of £1.3bn, up 61% YoY. Persistency remained high at 91% (Affluent) and 93% (High Net Worth). Adviser productivity rose 10% YoY to £3.4m annualised gross sales. Quilter’s platform surpassed £100bn AuMA in early Q4, marking a UK industry milestone.
“Our performance in 2025 continues to demonstrate the strength of our two distribution channels… Our scale and distribution reach makes us uniquely positioned to meet our customers’ needs.” – Steven Levin, Chief Executive Officer
BHP (BHG) Operational Update for Q1 FY26 (47845c)

Copper production rose 4% YoY to 494 kt, led by record throughput at Escondida. Iron ore output dipped 1% to 64 Mt due to planned maintenance, though WAIO achieved record material mined. Steelmaking coal production climbed 8% to 4.9 Mt, driven by Broadmeadow’s underground rates and open cut stripping. Energy coal fell 4% to 3.5 Mt due to wash plant maintenance. Jansen Stage 1 potash project reached 73% completion, with Stage 2 at 13%. Copper South Australia signed its largest renewable electricity agreement, advancing decarbonisation efforts.
BHP remains on track to meet FY26 guidance across all commodities. CEO Mike Henry noted, “With momentum from a strong first quarter, BHP is on track to deliver on full-year guidance and we are making progress on our growth pipeline across Australia and the Americas.” Copper market fundamentals tightened due to competitor disruptions, supporting pricing. China’s GDP growth is expected to reach ~5% in CY25, underpinning demand. Saraji South will enter care and maintenance from Nov ’25 due to royalty pressures.
South32 (S32) Quarterly Report for Sep 25 (3640c)

Australia Manganese production surged 83% QoQ to 854kwmt, driven by successful execution of its operational recovery plan and ramp-up of export shipments. Sierra Gorda copper equivalent output rose 12% due to higher copper grades and molybdenum recoveries. Cannington zinc equivalent production fell 19%, impacted by lower average metal grades despite improved underground mining. Insurance recoveries of US$153M were finalised for Tropical Cyclone Megan, bringing total to US$503M.
Hermosa’s Taylor shaft sinking and Clark decline construction progressed on schedule, with exploration drilling continuing at Peake. South32 welcomed US Government approval for the Ambler Access Road, unlocking high-grade copper and zinc potential. Climate Change Action Plan 2025 was published, outlining emissions reduction and resilience strategies. Net cash declined to US$64M due to Hermosa investment and working capital build. Capital expenditure totalled US$82M, with US$7M returned via buy-back. Cerro Matoso divestment remains on track for Dec 25.
Foschini (TFG) Trading Statement for 6M Sep 25 (9918c)
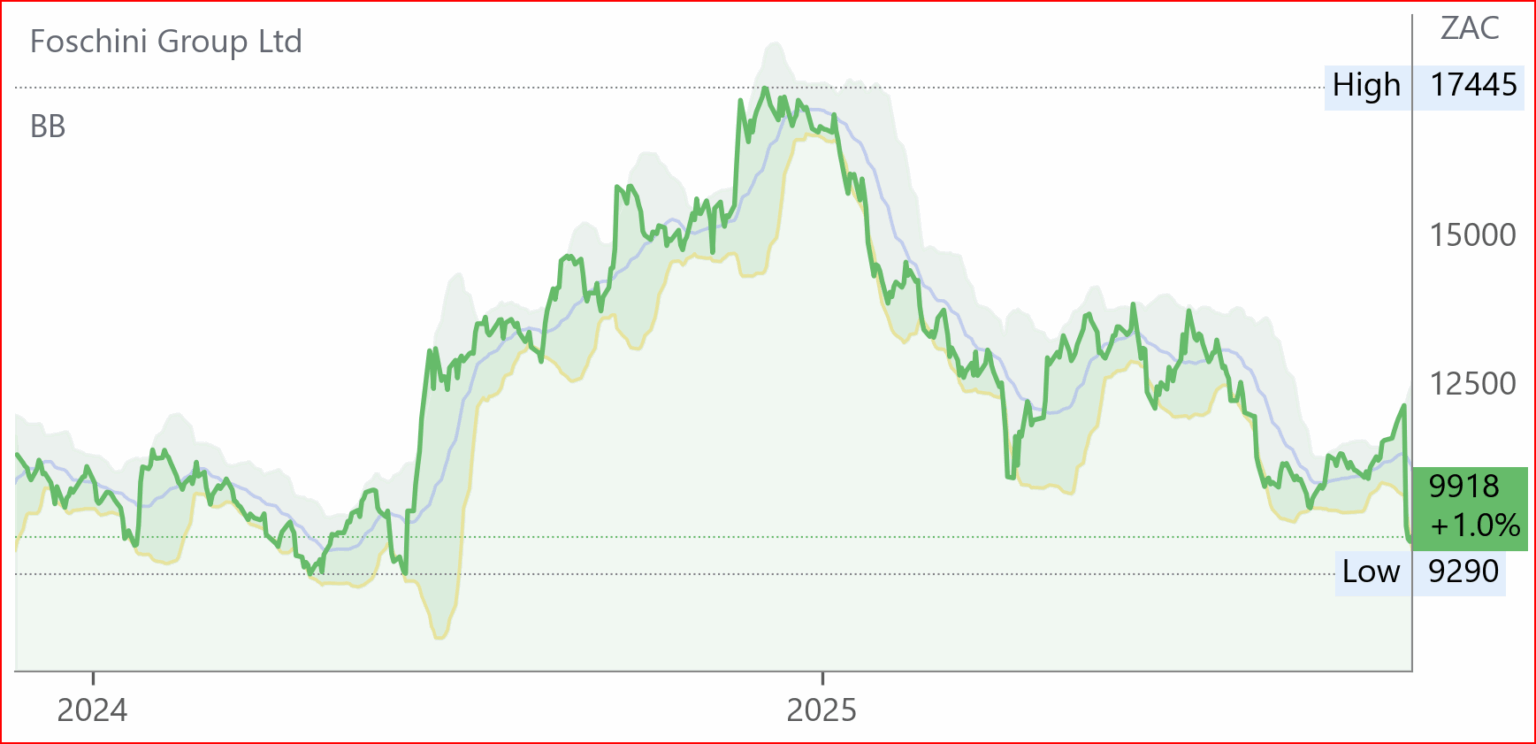
HEPS: 278.7–297.3cps (↓20–25% from 371.6cps)
EPS: 276.2–294.6cps (↓20–25% from 368.3cps)
Revenue: R29.2bn (↑12.7% from R25.9bn)
HEPS and EPS declined over 20% due to margin pressure, negative operating leverage, and increased finance costs linked to the White Stuff acquisition and lease renewals. Despite revenue growth, profitability was constrained by markdowns and subdued discretionary spend across key geographies.
Online sales rose 55.3%, now 14.7% of retail sales, driven by Bash platform and White Stuff integration. TFG Africa saw 5.3% growth, with credit sales up 7.9%. TFG London benefited from White Stuff’s 12.5% growth, offsetting weak UK macro. TFG Australia contracted 0.5% as inflation and store costs weighed on EBIT. Market share gains in Homeware and stable Apparel share were noted in South Africa.
Balwin (BWN) Trading Statement for 6M to Aug ’25 (284c)
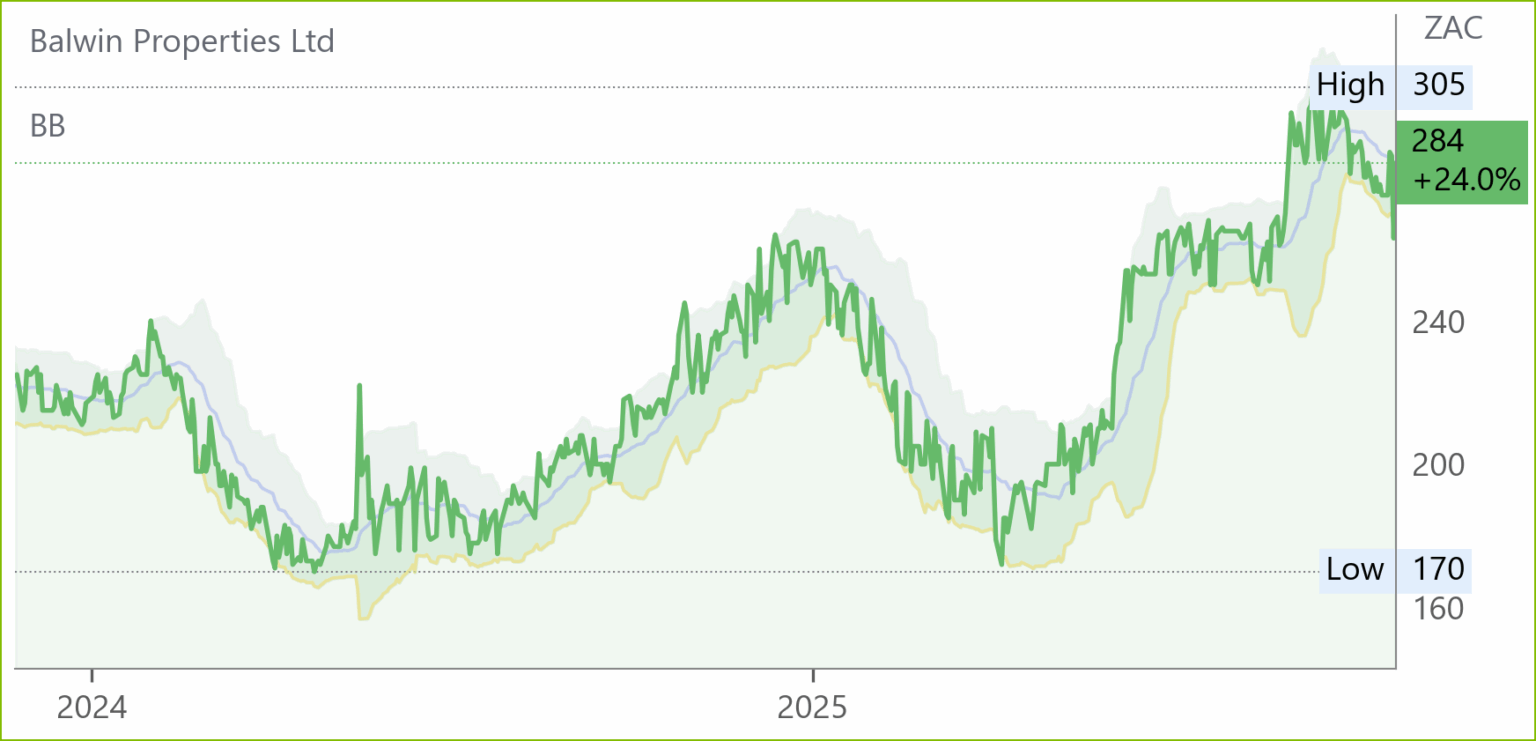
HEPS: 20.33c–21.14c (↑25.0%–30.0% from 16.26c)
EPS: 20.43c–21.24c (↑25.0%–30.0% from 16.34c)
HEPS and EPS increased by up to 30% due to improved unit sales, cost containment, and enhanced efficiencies across development projects. The uplift reflects stronger demand in key residential nodes and disciplined execution of Balwin’s development pipeline.
Sales momentum continued across flagship estates, supported by semigration trends and affordability-driven demand. Construction progress remained on track, with handovers aligned to forecast. Digital marketing and virtual tours contributed to higher conversion rates. Environmental certification initiatives and green building standards remain a strategic focus, with EDGE certification now standard across new developments.
“Balwin continues to deliver on its promise of quality, affordable lifestyle estates, underpinned by sustainable practices and customer-centric innovation.” – Steve Brookes, CEO.
Raubex (RBX) Trading Statement Update for 6M Aug 25 (4163c)
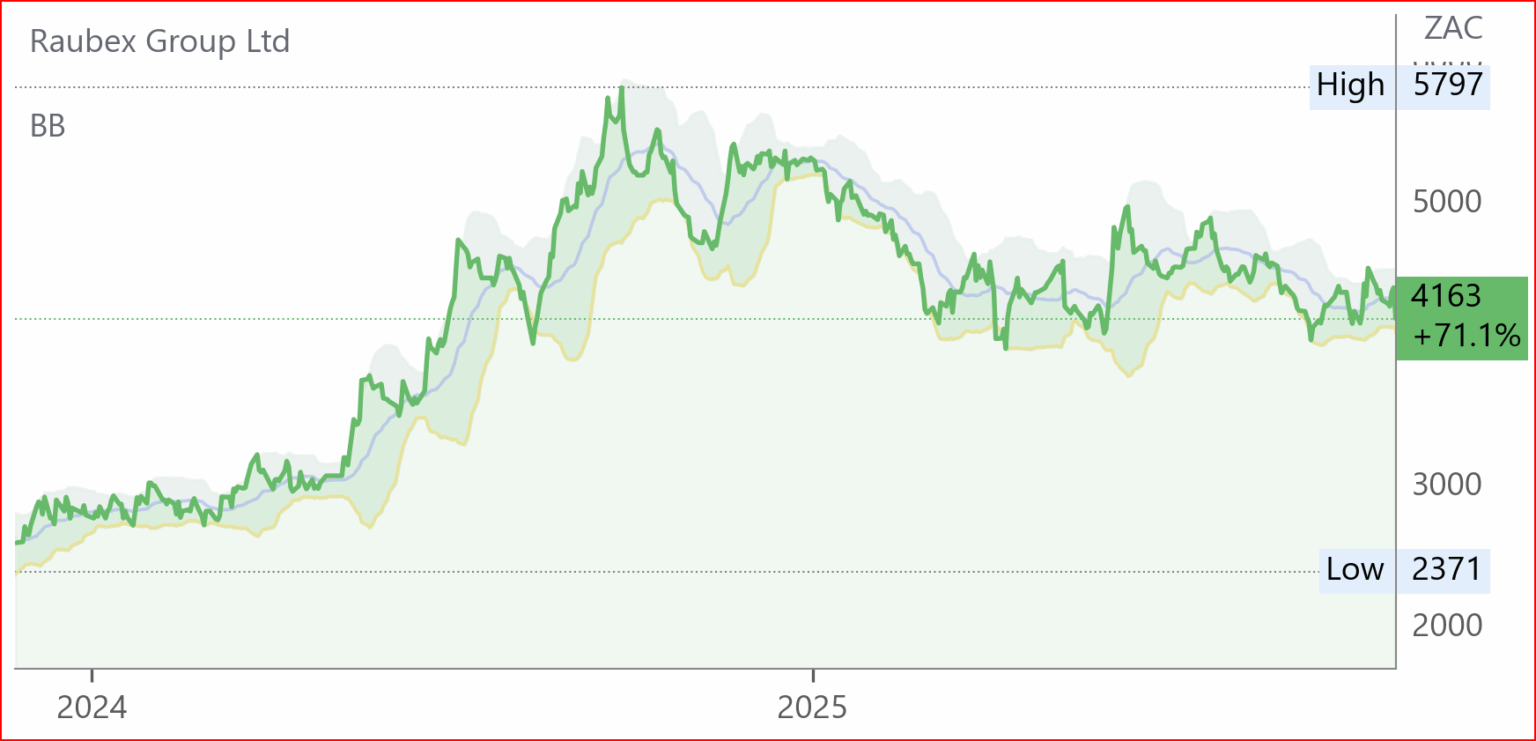
HEPS: 227.4c to 255.9c (↓10% to ↓20% from 6M Aug 24)
EPS: 228.8c to 257.4c (↓10% to ↓20% from 6M Aug 24)
HEPS and EPS declined due to margin pressure in the Construction Materials and Australia divisions, compounded by adverse weather and a terminated Australian project. Despite these setbacks, Roads and Earthworks and Infrastructure divisions delivered strong operating profit growth, partially offsetting losses.
Major SANRAL contracts boosted Roads and Earthworks, while Infrastructure benefited from renewable energy and housing projects. Construction Materials saw mixed performance, with gypsum sales offsetting bentonite weakness. Mining operations stabilised after prior chrome losses, and the newly commissioned PGM plant at Kookfontein is expected to contribute positively. Acquisition of Hlumisa Engineering
Results due 10 Nov ’25
Adcorp (ADR) Trading Statement for 6M Aug 25 (741c)
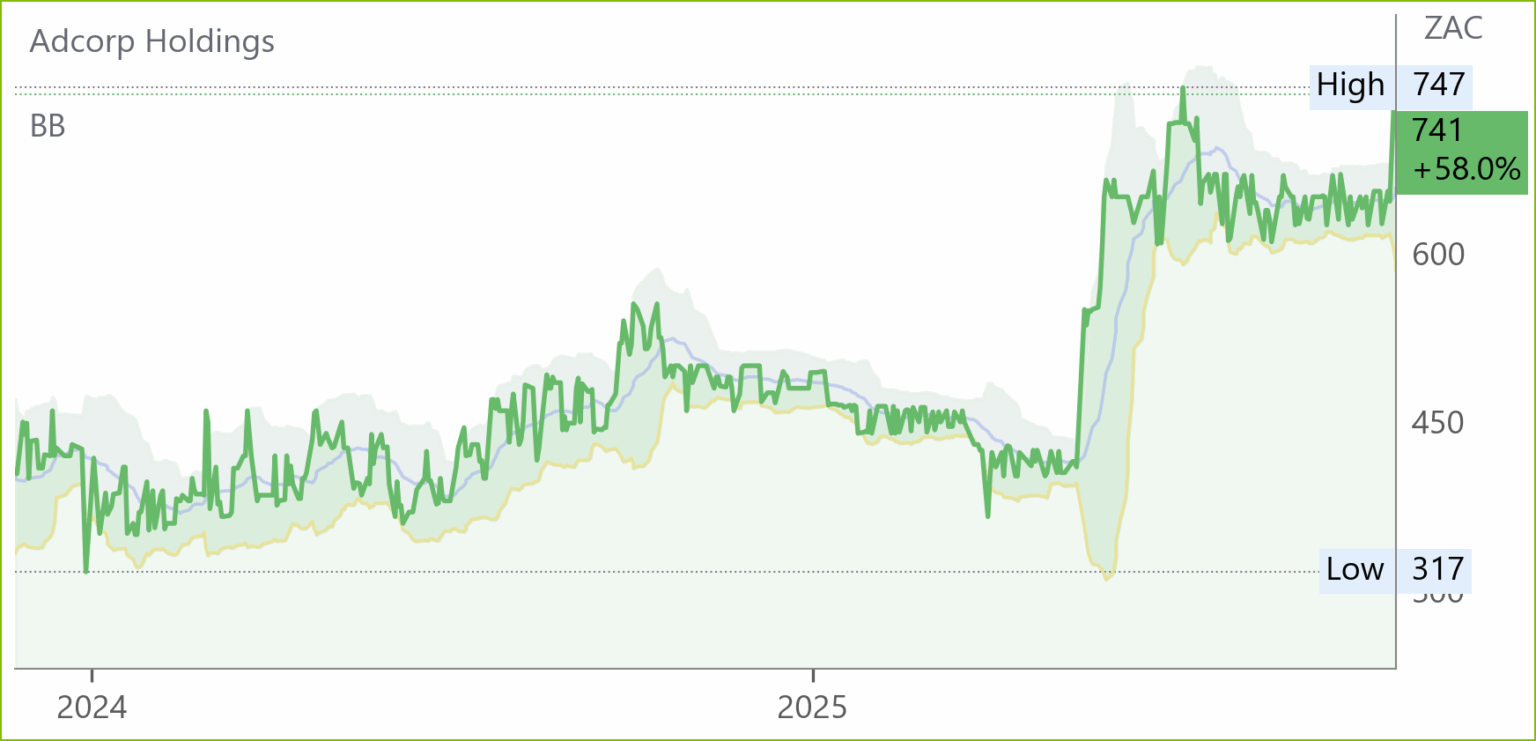
HEPS: 51.6–54.4cps (↑83.0%–92.9% from 28.2cps)
EPS: 51.6–54.4cps (↑83.0%–92.9% from 28.2cps)
HEPS and EPS surged over 80% due to disciplined cost control, stable gross margins, and operational efficiencies following restructuring. Prior period included R25.6m in once-off transformation costs, which were not repeated, further boosting comparability.
South African operations benefited from resilient demand in logistics, manufacturing, and consumer-facing sectors, supporting Contingent Staffing and Staffing Solutions. Professional Services faced muted hiring sentiment but showed early signs of improvement due to structural changes. In Australia, Contingent Staffing remained stable through client retention and renewals, while Professional Services began to benefit from a pivot to higher-margin tech and consulting work.
Management enters H2 with a leaner cost base, strong liquidity, and improved working-capital discipline. Focus remains on margin preservation, cash generation, and selective growth. Results due 30 Oct ’25
TABLE
Coronation (CML) Trading Statement for FY25 (4911c)
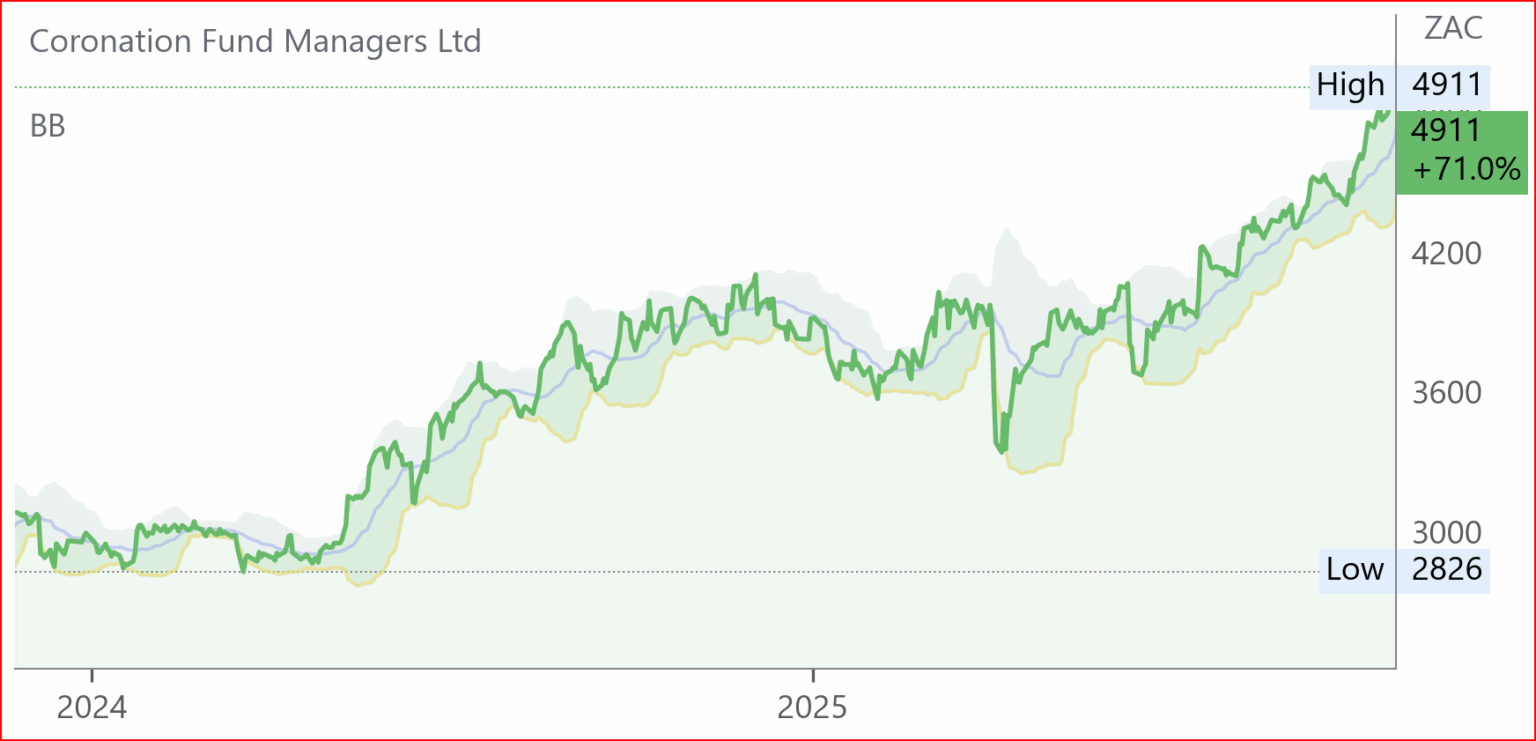
HEPS: 441.4c–504.4c (↓20.0%–30.0% from 630.5c)
EPS: 441.4c–504.4c (↓20.0%–30.0% from 630.5c)
AUM reached R761bn as at 30 Sep ’25
HEPS and EPS declined due to the prior year’s once-off reversal of a tax provision following Coronation’s successful litigation against SARS. This matter had no recurring impact, and the business remains focused on long-term client outcomes and disciplined cost control. Excluding this, fund management EPS rose 5.0%–15.0% to 423.0c–463.3c, reflecting underlying operational growth.
“Coronation remains committed to delivering competitive long-term returns and maintaining operational resilience across market cycles.” – Anton Pillay, CEO
Results due 18 Nov ’25.
Jubilee (JBL) Operational Update for Q1 FY26 (63c)

Chrome production fell 11.2% to 404 151t and PGM output declined 10.1% to 8 382oz, both impacted by the cessation of the OBB supply contract. The drop was partially offset by increased output from Thutse and third-party partnerships. No financial metrics were disclosed. Chrome output is now 64.1% sourced from partnerships. A new PGM joint venture completed trial runs and is being upgraded for Q3 FY26 launch.
Jubilee received shareholder approval for the sale of its South African Chrome and PGM operations, with US$15m already paid. Only two conditions remain: Competition Commission approval and audited accounts for FY25, due in Nov ’25.
Snippets
Prosus (PRX) now holds 98.19% of Just Eat Takeaway.com shares following its public offer. An additional 8.06% was tendered during the post-closing acceptance period. JET will delist from Euronext Amsterdam on 17 Nov ’25, with settlement on 21 Oct ’25. Prosus will initiate squeeze-out proceedings to acquire the remaining shares and terminate the ADS deposit agreement.
Harmony (HAR) has finalised the acquisition of MAC Copper for US$1.01 billion, securing full ownership of the high-grade CSA copper mine in Australia. Funded via cash and a US$1.25 billion bridge facility, the deal boosts Harmony’s copper exposure and global footprint. Integration begins immediately, with CSA’s life-of-mine plan aligned to Harmony’s FY27 strategy.
Pan African Resources (PAN) has completed its transfer from AIM to the LSE’s main market, with trading commencing at 8:00am today. No new shares are issued. The company retains its ISIN (GB0004300496) and ticker (PAF).
Sibanye-Stillwater (SSW) finalised new chrome agreements with the Glencore Merafe Venture, effective 1 Nov ’25. The deal accelerates chrome volume delivery by 20 years, boosts free cash flow, and enhances operational synergies. Glencore’s processing expertise is expected to reduce costs and improve yields. CEO Richard Stewart called it “a pivotal step in unlocking long-term value from our chrome by-products.”
Reinet Fund’s (RNI) NAV rose to €6.66 billion as at 30 Sep ’25, up €56 million from Jun ’25. NAV per share increased to €38.87. The uplift reflects fair value adjustments across its portfolio, including Pension Insurance Corporation. Reinet Investments S.C.A.’s consolidated NAV will differ due to additional parent-level assets and liabilities. Full NAV disclosure is pending.