
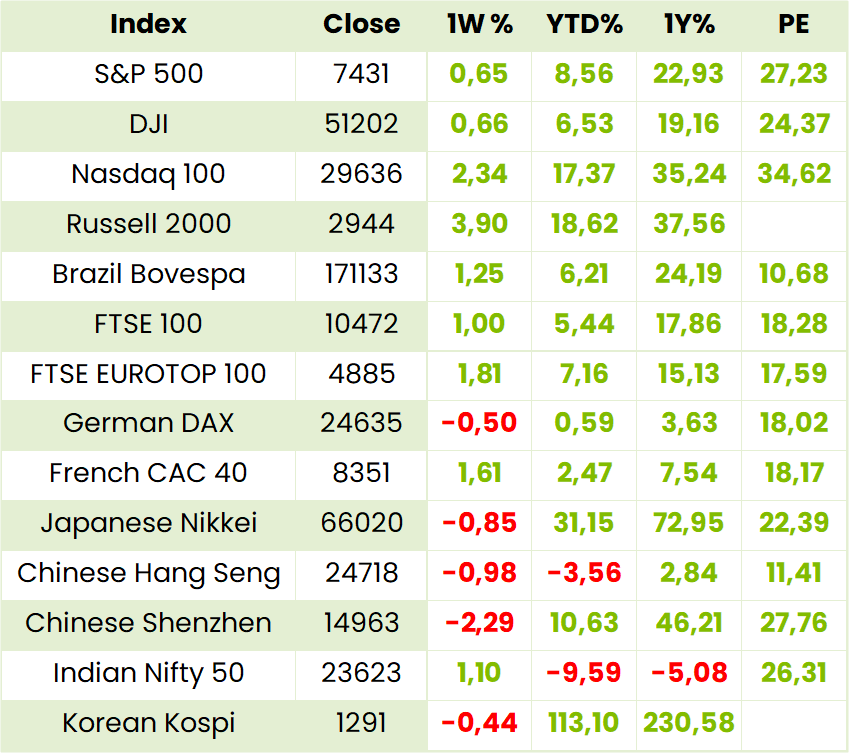
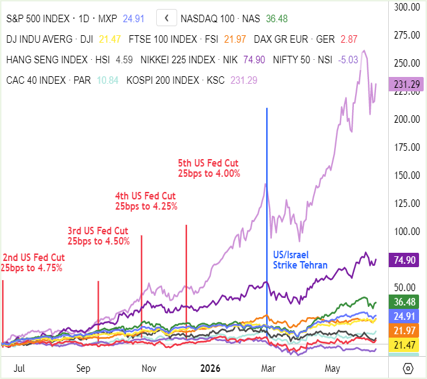
Global Indices
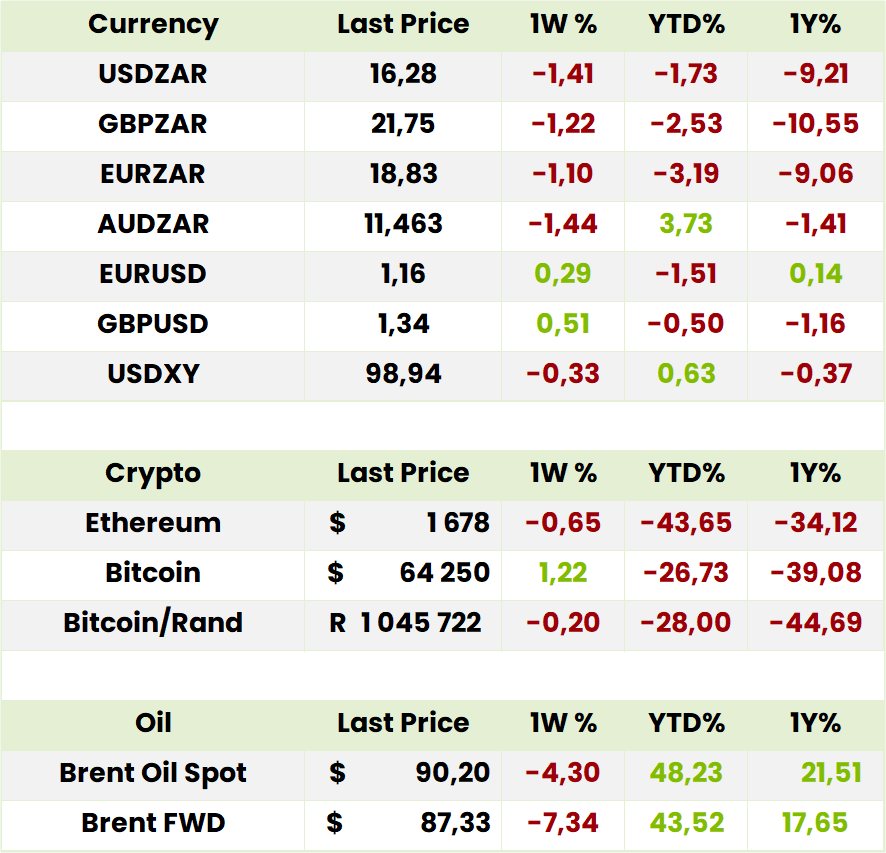
Currencies, Crypto & Commodities

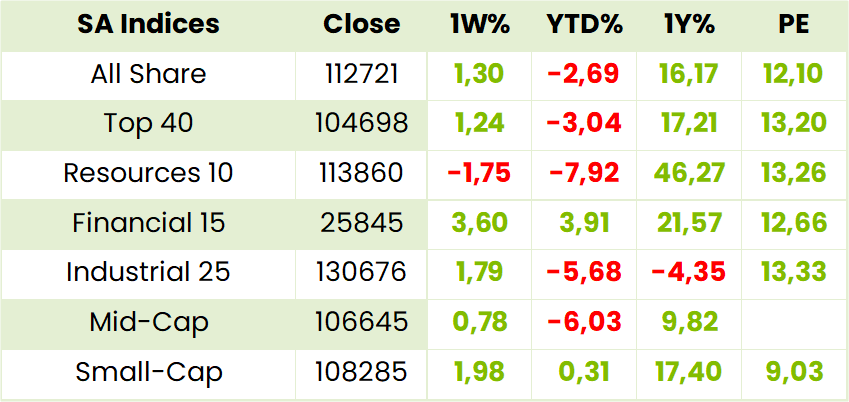
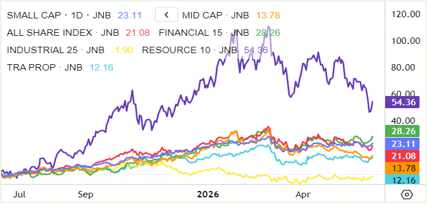
SA Indices
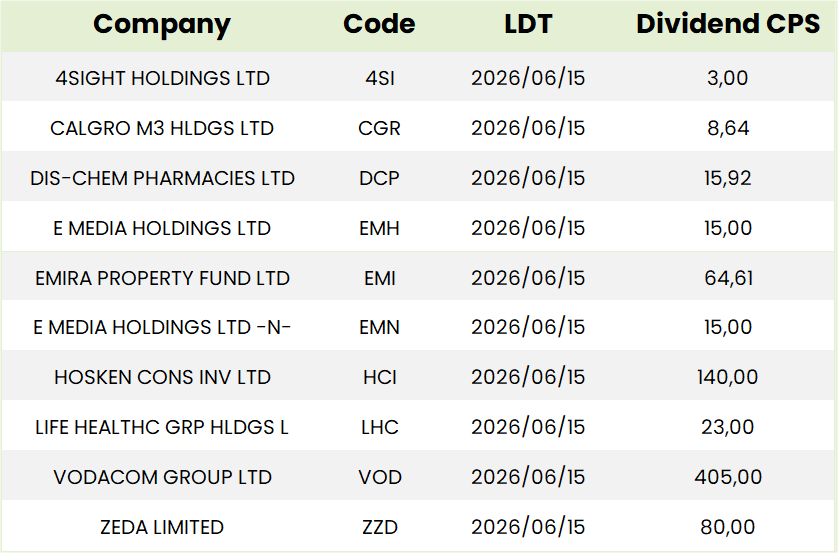
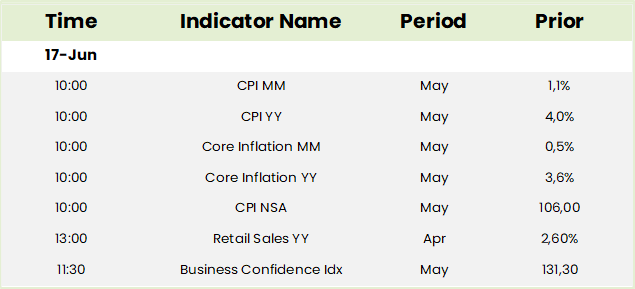
SA Upcoming Indicators & Dividends

*holding in a Finova portfolio
Omnia (OMN)* Financial Results for FY26 (11165c)

HEPS: 849c (+21% from 704c)
EPS: 861c (+24% from 692c)
Operating Profit: R2 170m (+28% from R1 698m)
Revenue: R24 200m (+6% from R22 818m)
EBITDA: R2 775m (+21% from R2 302m)
Dividend: 470c ordinary (+18% from 400c); 280c special (+2% from 275c)
Revenue growth was supported by strong Agriculture (+13%) and Mining (+8%) segments, while Chemicals contracted (-38%) but improved profitability. Operating profit rose 28% on volume growth and margin expansion, with EBITDA up 21%. Agriculture RSA volumes increased despite input cost pressures, while Mining benefited from iron ore and platinum demand but faced coal and diamond sector weakness. Chemicals streamlined operations, closing unprofitable lines and boosting Water Care margins. ESG metrics improved, including lower CO₂ intensity and higher renewable energy use. CEO Seelan Gobalsamy stated: “Omnia delivered a strong FY26 performance, demonstrating disciplined execution in a complex operating environment.”
Comment: Omnia is steadily building its relevance in agricultural and mining explosives markets, not only in SADC and West Africa but also in Indonesia, Australia, the US and Canada. While it is reasonably valued on a 12.9x PE and 4.3% DY (excluding the 280c special dividend)management points out that the global explosives industry is consolidating. So, Omnia looks attractive on a 5.7x Ev/Ebitda relative to peers such as Chile’s Enaex on 8.0x, EPC 8.0x (Paris), Dyno 10.3x and Orica 8.2 (Oz), and Indian peers ranging from 10.3x.

Sygnia (SYG)* Interim Results for 6M Mar ‘26 (3307c)

HEPS: 138.1c (+22.0% from 113.2c)
EPS: 138.1c (+22.0% from 113.2c)
Operating Profit: R216.0m (+25.1% from R172.6m)
Revenue: R616.1m (+24.3% from R495.7m)
Dividend: 122.0c interim (+24.5% from 98.0c)
Assets under management increased 13.6% to R460.8bn, supported by net inflows and continued demand for passive investment products. Revenue rose 24.3% and profit after tax advanced 25.1%, reflecting operational leverage and cost discipline. Interim dividend was lifted 24.5% to 122.0c per share, underpinned by strong cash reserves. Retirement fund administration and digital platforms expanded client reach, while technology-led solutions strengthened competitive positioning. CEO Magda Wierzycka noted: “Sygnia continues to deliver robust growth, driven by innovation and client trust, despite challenging market conditions.” Outlook highlights further expansion of index-tracking funds and digital solutions to capture market share.
Comment: Sygnia’s chances of thus capturing market share are good as individual investors continue to resort to passive funds as a means of participating in, and navigating through, AI and other areas of global growth. Like its peers it is realistically priced on a 12.1x PE and a generous 7.7% DY.
The 5 year after tax profit CAGR was 12.9% but Retail grew much faster from R37.1m to R90.4m than Institutional which grew from R215m to R411m.
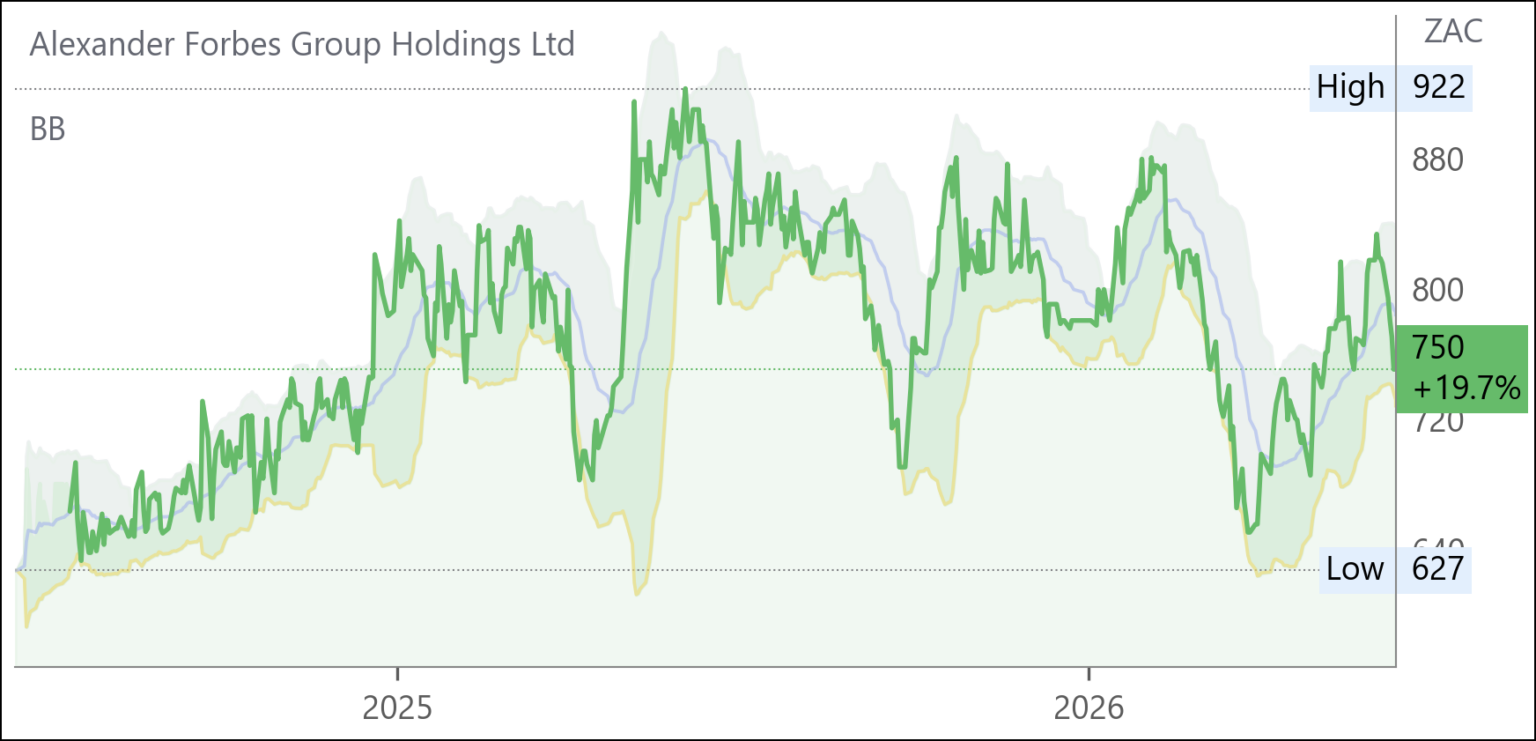
Alexander Forbes (AFH) Financial Results FY26 (750c)
HEPS: 67c (↓5% from 70.8c)
EPS: 66.4c (↓6% from 70.8c)
Operating Profit: R1.024bn (↑12% from R911m)
Revenue: R4.848bn (↑10% from R4.397bn)
Dividend: 57c per share (Final: 33c; Interim: 24c)
Operating income rose 10% on higher assets and strong retail inflows, while normalised profit climbed 22%. Retail AuM grew 21% to R112.3bn, with adviser force expanding to 315. Closing assets surged 22% to R733bn, supported by resilient institutional flows. CEO Dawie de Villiers highlighted disciplined execution, technology modernisation, and client retention as key drivers. Outlook emphasises preparedness amid regulatory and geopolitical uncertainty, with AI adoption and sustainability advisory strengthening long-term positioning.
Comment: despite its 39% 5 year HEPS CAGR and 21% DPS CAGR, Alexander Forbes , like its peers, is modestly priced on an 11.7x PE and 7.7% DY CAGR. FY 26 HEPS on a normalised basis was, however, stationary at 69.0cps despite 17% and 15% growth respectively in earnings from the Investment and Retail divisions which together comprised 49% of total earnings. There is a strong case for Buying at these levels although Sygnia may benefit from being more focused on its two, Retail and Institutional, segments.

SPAR (SPP)* Interim Results for 26W Mar ’26 (5213c)

HEPS: 199.9c (↓53.9% from 433.8c)
EPS: 151.5c (↓62.0% from 398.8c)
Operating Profit: R730.7m (↓45.3% from R1.35bn)
Revenue: R67.5bn (↑3.6% from R65.2bn)
Gross Profit: R7.1bn (↑1.6% from R7.0bn)
EBITDA: R882.0m (↓39.7% from R1.46bn)
Dividend: Nil (Prior Period: Nil)
Operating profit fell sharply due to KZN distribution centre disruption, Black Friday overspend, and higher debtor costs. Net debt rose to R7.3bn, with leverage at 2.73x. Ireland delivered resilient growth, while Southern Africa margins were compressed. Retailer loyalty stabilised at 78.5%, and SPAR Health revenue surged 26.1% on pharmacy integration. Portfolio simplification concluded with UK exit, leaving focus on Southern Africa and Ireland. CEO Reeza Isaacs noted execution priorities and commercial transformation initiatives aimed at margin recovery. Outlook highlights stabilisation in KZN, non-recurrence of Black Friday overspend, and improved service levels expected to lift H2 FY26 performance.
Comment: with the slump in profit attributed to what CEO Isaacs terms “own goals” at a regional level (KZN), management changes, again at a regional level, have been implemented. Although Isaacs declines to give any target or timelines for recovery it is only a matter how substantial it will be. Given then that the Irish business is performing well and the English and Swiss businesses are out of the system there is a case for holding for recovery which a 12 month FPE of 6.1x is not yet pricing in. Long term investment should rather await assessment of KZN turnaround measures as well as other issues including retailer profitability and the SPAR2U on demand offering.

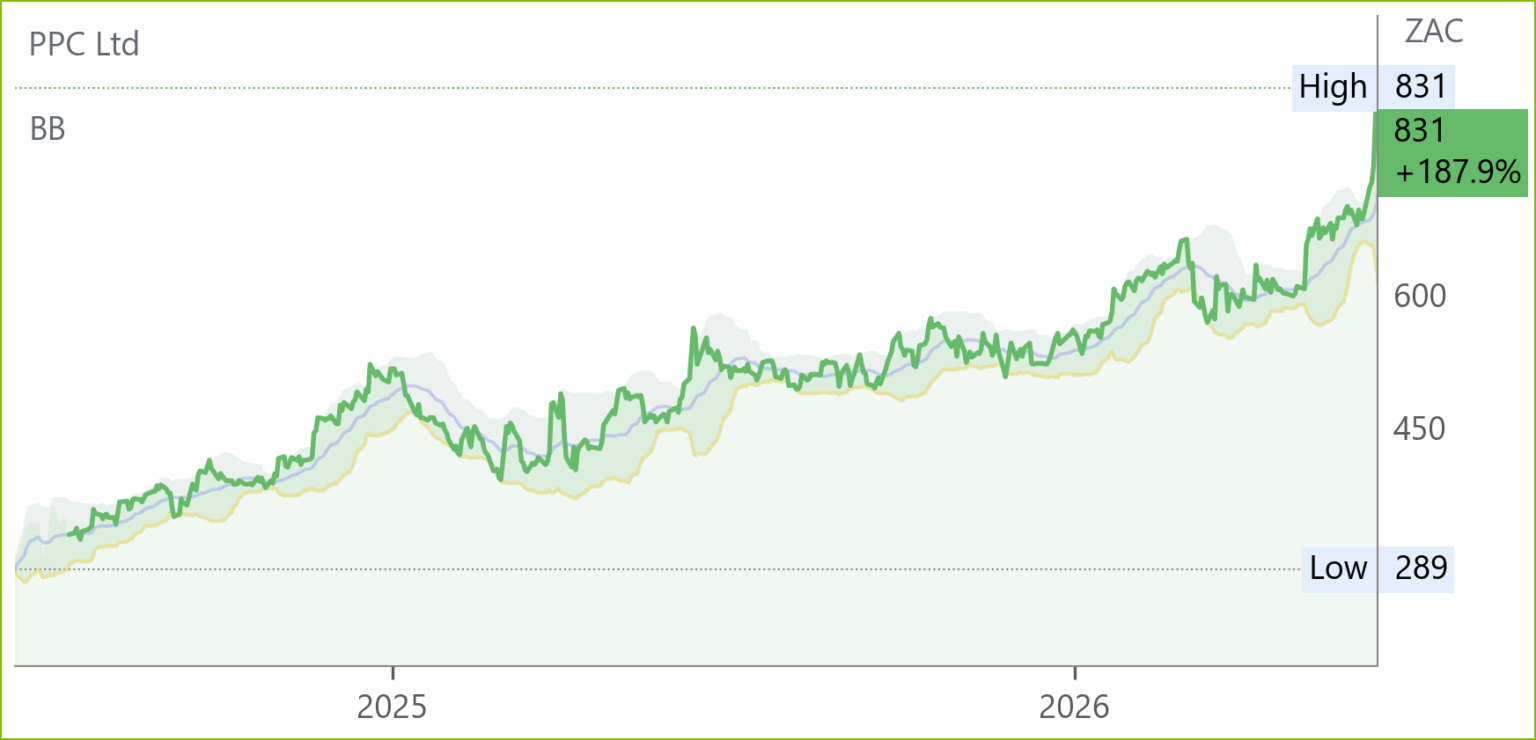
PPC (PPC) Financial Results for FY26 (831c)
HEPS: 50c (+25% from 40c)
EPS: 56c (+75% from 32c)
Operating Profit: R1 473m (+50% from R982m)
Revenue: R10 255m (+3.9% from R9 871m)
EBITDA: R2 079m (+31% from R1 593m)
Dividend: 30.2c per share (ordinary)
EBITDA rose 31% with margins expanding to 20.3%, driven by cost optimisation and efficiency gains in SA cement operations, while Zimbabwe delivered 18% volume growth despite a temporary plant breakdown. Cash generation strengthened, net cash inflow before financing rose 23% to R1.3bn, and ROIC improved to 16.7%. CEO Matias Cardarelli highlighted: “What was once thought by many to be impossible, is being made real by the new PPC team… This performance significantly exceeded expectations and has positioned PPC for its next step change, anticipated in FY28.” Construction of the new Western Cape plant (RK3) remains on track for FY27, underpinning future growth.
Comment: on a 16.6x PE the stock is only beginning to price in the “step change” FY28 growth from the Western Cape and solar plant in Zimbabwe. As regards the latter , which contributed 63% to the FY 26 bottom line, “the operating environment is anticipated to remain sound, supporting steady and sustainable growth.” Overall, therefore, the stock looks well placed to benefit substantially from the expected pickup in SA infrastructural spending.

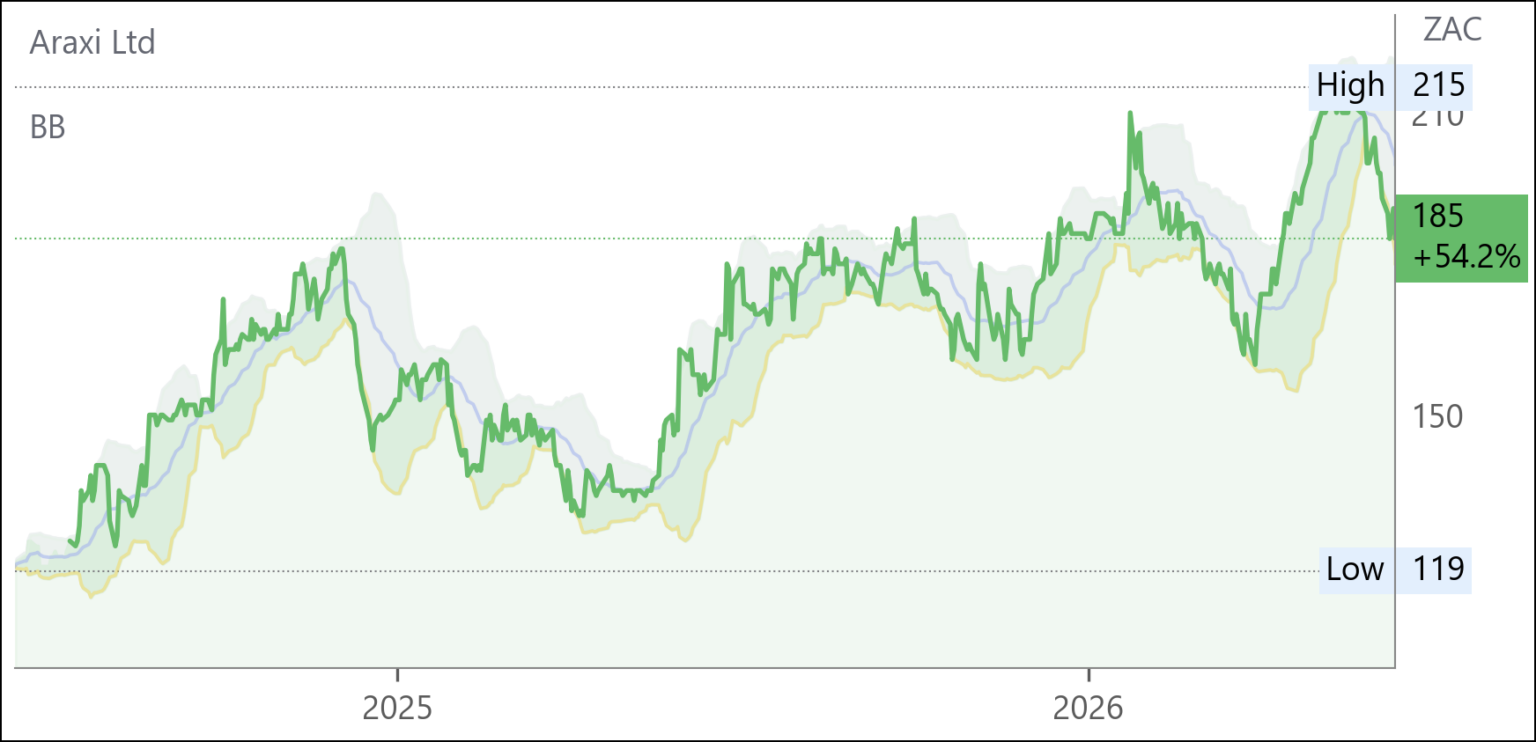
Araxi (AXX) Financial Results for FY26 (185c)
HEPS: 14.37c (↓18.2% from 17.57c)
EPS: 14.38c (↓18.2% from 17.58c)
Operating Profit: R226.4m (↓20.7% from R285.4m)
Revenue: R1,166.2m (↓6.8% from R1,250.7m)
EBITDA: R279.3m (↓16.4% from R333.9m)
Dividend: 12.00c per share (final 7.50c; unchanged YoY)
Operational momentum was strong despite global chip shortages delaying terminal deliveries. Recurring terminal licence fees rose 31%, while Software EBITDA surged 77% following restructuring. The Pay@ acquisition strengthens the Payments division and diversifies revenue streams. Rebranding to Araxi Limited and rightsizing initiatives reduced costs and improved capacity utilisation. Management highlighted growing demand for AI, cybersecurity, and cloud solutions. Executive Chairman Michael Pimstein noted: “We are very pleased with how these initiatives have unfolded and the positive outcomes in each case.” The Group enters FY’27 with cautious optimism, supported by pipeline growth and shareholder confidence in its long-term strategy.
Comment: Heps growth was 10.1% on an underying basis and, given that Pay@ was paid for but its results were not included for FY26, we can safely predict at least 15% heps growth for FY 17 which puts it on a modest FPE of 11.2x. “Clients have increasingly turned to the Group to leverage its specialist capabilities in alternative payment solutions, cloud computing, AI, agentic AI, cybersecurity, and intelligent data to deliver sophisticated digitalisation solutions that enhance clients’ competitiveness, efficiency, and customer experience.” This is evidenced by the fact that, whereas terminal sales increased by 5.4% to 447000 units and terminal licence fees grew by 31%, “Software (is) gaining strategic traction with a 77% increase in underlying EBITDA”. With more acquisitions likely to boost innovation offerings to clients the stock is an early stage growth BUY.

Resources Retrace…





Junior Mining Indaba
This two day event last week understandably received minimal media attention but is worth noting by JSE investors as it confirmed the massive as yet unexplored mineral endowment awaiting exploitation in SA itself as well as the burgeoning mining industries in Southern Africa with the now highly rated mining jurisdictions of Botswana, Namibia, Angola and Zambia. Although there were the usual references to government and DMRE responsibility for SA’s dismal dive on the Fraser Institute’s global rating of mining jurisdictions, there was a perceptible shift towards the need for acknowledgement of the positives including the probability that the long awaited mining cadastre would be fully operative by mid-2027. The conference opened with a very strong affirmation by Anglo American of its strong and enduring commitment to SA despite the Anglo Tech merger and the decades long “simplification” which has left it focused mainly with manganese and a quality iron ore operation in SA. This included references to the potential for copper in the Northern Cape (which extends beyond the remit of Orion and Copper 360.) Given the lunacy of the decades long dearth of exploration in SA, Anglo pointed out that exploration was the life blood of the mining industry. Several juniors, including Aussies and other foreigners, commented that they had had very helpful interactions with the DMRE. Gwede Mantashe’s statement at the opening of the West Wits gold mine in December last year that mining in SA was a sunrise industry not a sunset industry elicited rare approval. Other juniors listed elsewhere included Lexington Gold (JV with Harmony Gold), Andrada Mining (Namibia and TSX), Botswana Minerals (LSE-North Damara Copper region), Pensana Minerals (LSE), Marula Mining (AQSE Growth Market). Others pointed to the fact that, while 2bn oz of gold had been mined in SA some 1.5bn were left in the ground.
In addition to West Wits there is the “Snake Road Project”, an open pit mine, due to start in the Benoni Backyard” soon! If nothing else the Indaba confirmed that, properly incentivised, the SA mining sector still has plenty of legs and long range potential worth keeping an eye out for. Finally, it was also noted that there has been an increasing amount of capital from the Middle East investing in Central Africa which, hopefully, will be inspanned further south in due course.
Trading Statements & Updates
Jubilee Metals – Molefe Mine Operational Update Highlights
- ROM deliveries to Sable refinery recommenced after Pit 2 expansion.
- High-grade ROM deliveries: 6,000t in Jun ’26, 8,500t in Aug ’26, targeting 10,000tpm by Oct ’26.
- Combined mined copper reef expected to reach 60,000t per quarter at 6:1 stripping ratio.
- Ramp-up from ~12,000t to >30,000t per quarter of HG Cu ore.
- Phase 2 drilling programme to deliver JORC-compliant resource by Q4 CY’26.
- Next phase: on-site ore sorting and processing to improve copper recovery.
CEO Leon Coetzer: “Molefe Mine is evolving into a cornerstone asset within our integrated mine-to-metals platform.”
Snippets
Afrimat (AFT) confirmed disposal of divestiture businesses as required by the Competition Tribunal for its Lafarge acquisition. The sale includes non-core brick, block, and readymix operations, aligning with portfolio simplification and regulatory compliance. This step strengthens Afrimat’s focus on aggregates, iron ore, and industrial minerals, while ensuring adherence to merger conditions.
Pan African (PAN) received conditional ASX admission for dual listing alongside JSE and LSE. The Emmerson Resources acquisition remains subject to shareholder approval on 15 Jun ’26 and Australian Court sanction. Implementation is set for 1 Jul ’26, with ASX trading from 2 Jul ’26. CEO Cobus Loots emphasised strategic growth through Emmerson’s assets, enhancing production and investor reach.
MTN (MTN) aims to capture 30% of Africa’s home connectivity market within five years by expanding fixed‑wireless and fibre services to 20 million households, up from 2.8 million today. The strategy, part of Ambition 2030, targets South Africa, Nigeria, Ghana, and Uganda. MTN also plans to grow digital entertainment through its low‑cost, locally focused streaming service, MTN One TV
SPAR (SPP) is rebooting its 2U delivery app to counter Checkers Sixty60 by focusing on local store individuality and community ties. CEO Reeza Isaacs admits the group was late to on‑demand retail and must differentiate beyond convenience. Over 600 stores already use 2U, with Uber Eats extending reach. A new team will drive tech enablement and user experience improvements.