Finova Investor Digest
Global Indices, Currencies, Crypto & Commodities

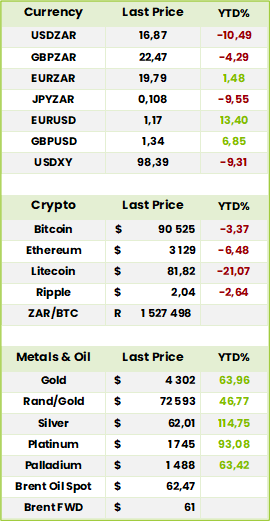
Global Indices 1 year to Date
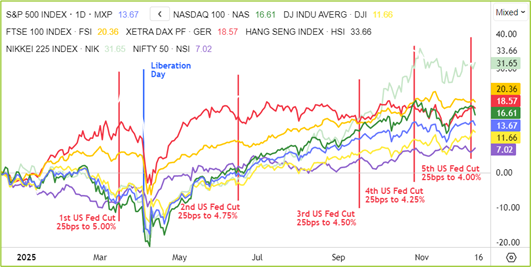
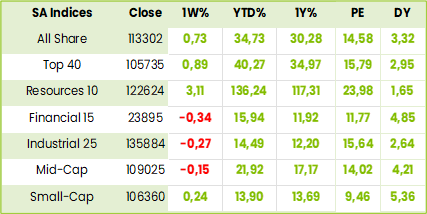
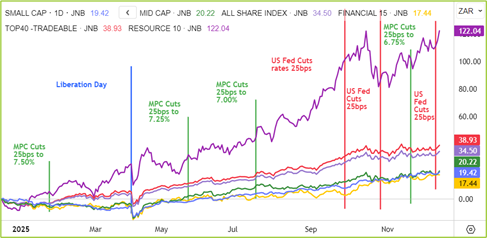
SA Indices
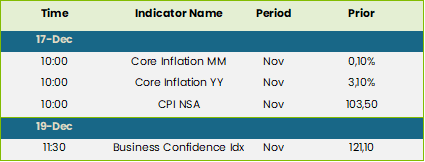
SA Upcoming Indicators & Dividends

SA Equity
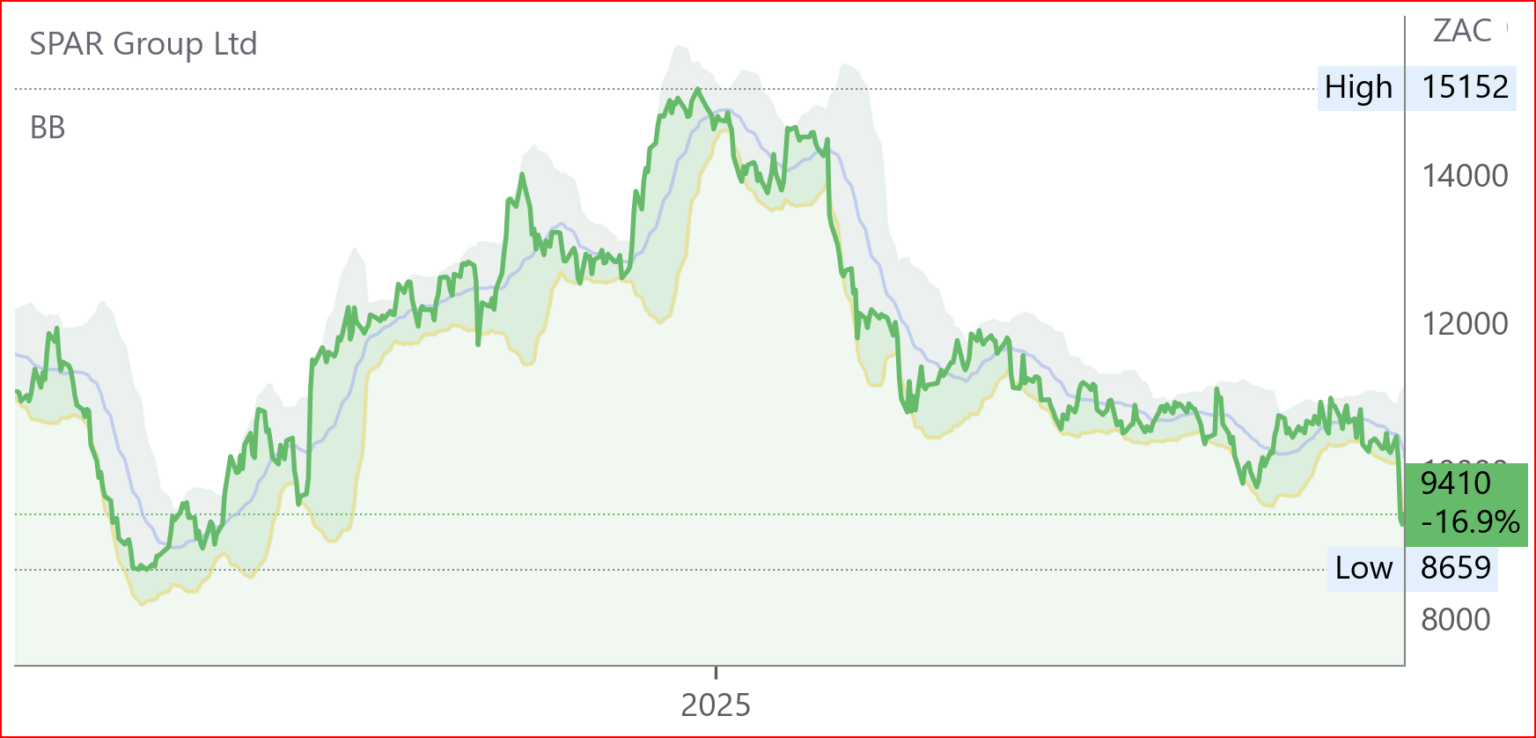
Spar (SPP) Financial Results for FY09/25 (9410c)
 HEPS: 768.9c(↓8% from 834.3c)
EPS: 452.7c (↓50% from 896c)
Operating Profit: R2.78bn (↑2.3% from R2.72bn)
Revenue: R132.4bn (↑1.6% from R131.5bn)
Gross Profit: R14.24bn (↑3.3% from R13.78bn)
EPS fell sharply due to impairments and extraordinary items, while HEPS also declined significantly, reflecting strategic exits and higher financing costs.
Trading momentum improved in H2 FY25, supported by stronger grocery and liquor volumes, disciplined promotions, and reduced fuel costs. Retailer loyalty remained resilient at 78.6%, while on-demand channels surged 136% year-on-year, boosted by a partnership with Uber Eats. Pet Storey was launched following the acquisition of Pet Masters, with all 12 stores converted by Nov ’25. Net debt reduced 40% to R5.4bn after European disposals, strengthening gearing to 1.74x. Ireland delivered stable revenue growth, while the Sri Lanka JV expanded its footprint. Outlook highlights margin restoration in Southern Africa and disciplined capital allocation.
Comment: CFO Isaacs admitted that with disposals, impairments and discontinued operations, there was a lot of noise and moving parts in the accounts which made them difficult to follow. He said, however, that with Poland and Switzerland gone and the UK held for sale the cleanup was largely complete so management could focus on existing operations without the distractions and regulatory burdens that the exited businesses had entailed over the years. Operationally the SA and Irish operations look set for a better year while the Sri Lanka JV operation seems to be progressing steadily. On an 8.3xFPE the stock is understandably priced well below its peers and we don’t see that changing without evidence, say, at the FY26 interims, that the recovery process has established irreversible momentum.

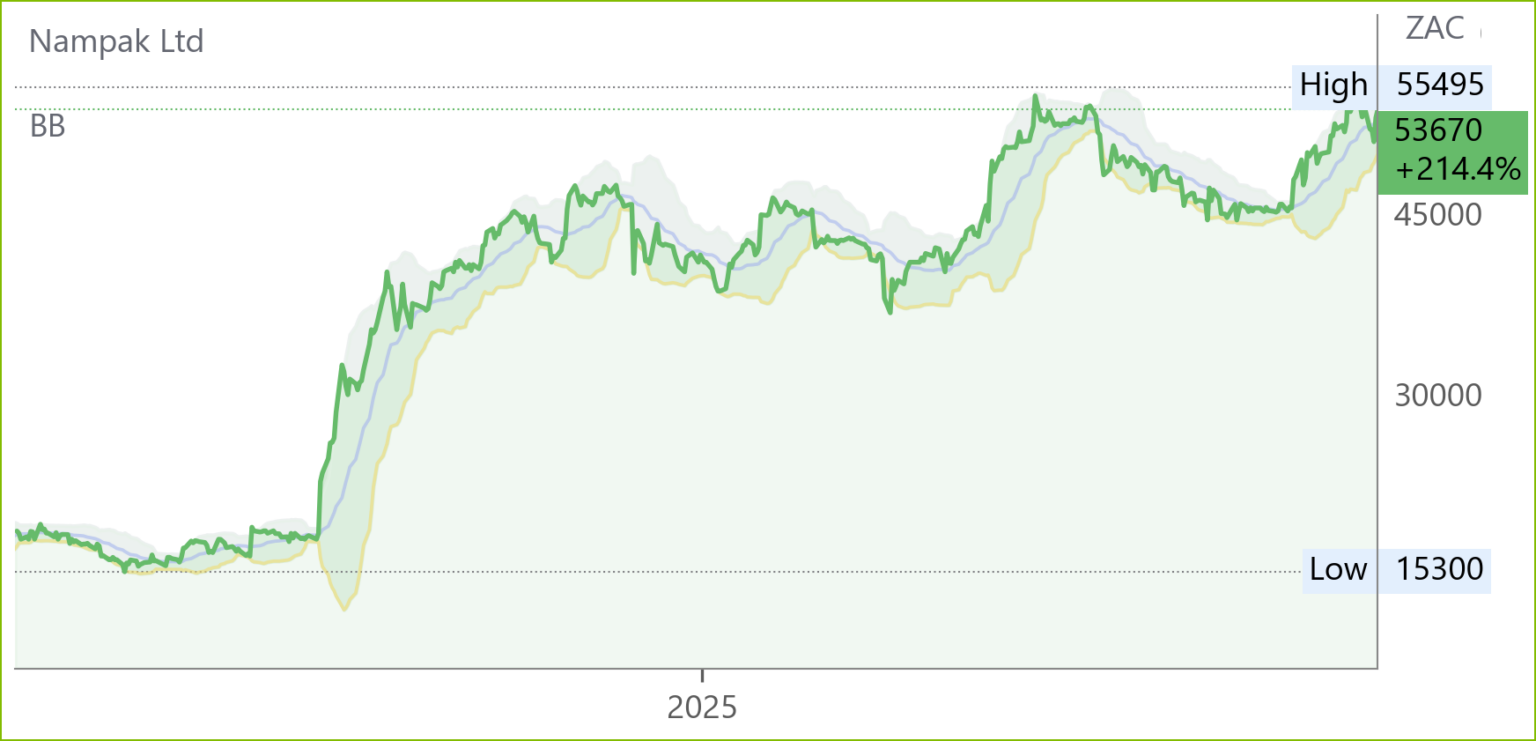
Nampak (NPK) Financial Results for FY25 (53670c)
HEPS: 10 510.0c (↑213% from 3 361.1c)
EPS: 13 971.8c (↑85% from 7 554.0c)
Operating Profit: R1.95bn (↑13% from R1.72bn)
Revenue: R10.73bn (↑8% from R9.96bn)
EBITDA: R1.86bn (↑26% from R1.48bn)
HEPS rose more than 200% due to strong trading, disposals, and lower finance costs, while EPS grew at a slower pace, reflecting once-off capital and other items.
Performance was supported by Beverage Angola’s 30% EBITDA growth, improved efficiencies in Beverage SA, and disciplined cost management. Net debt reduced 52% to R2.1bn, aided by R1.5bn asset disposals and a R237m insurance claim, lowering gearing to 77%. Discontinued operations delivered R2.4bn profit, mainly from Bevcan Nigeria’s disposal. Free cash flow surged to R1.0bn from R215m. Net asset value per share doubled to R298. Outlook highlights resilience in Beverage SA, growth opportunities in Angola, and portfolio optimisation in Diversified SA.
Comment: following the Nigerian disposal, there are still some moving parts both literally, with a complete line from the Angolan operation in containers on its way to Springs via Durban and the N3, as well as financially with total assets of R10992m including R936m held for sale being mainly the Zimbabwean operation. Despite NAV doubling to R298ps, the share price, at R510, is trading at a 71% premium to it. ROIC is, however, at 22.7% comfortably above WACC at 12.4%. The leverage ratio, which improved to 2.0 ahead of schedule, excludes Angolan ebitda and would be 1.1x if the expected proceeds of the Zimbabwean disposal were to have been included. While the diversified canning business is currently somewhat subdued owing to the (Peruvian induced) vagaries of the fishing industry the outlook for the beverage canning industry, both in SA and Angola, is positive with the former likely to benefit further when the Angolan line comes into production in Springs in FY27. With normalised HEPS from continuing operations at 7740cps the stock is on a 6.6PE and, with Chairman saying the Board would very much like to pay a dividend in FY27, some anticipatory BUYing would appear to be in order now.

Operating Updates & Trading Statements
Absa (ABG) Voluntary Trading Update for FY25 (22796c)

HEPS: Low double‑digit ↑ (vs FY24)
EPS: Low double‑digit ↑ (vs FY24)
Operating Profit: Low to mid‑single digit ↑ (vs FY24)
Revenue: Mid‑single digit ↑ (vs FY24)
Dividend: 55% payout ratio maintained
CET1 Ratio: Expected at top end of 11.0%–12.5% range
Net interest income growth remains muted due to modest retail loan growth and margin compression. Strong trading revenue and wholesale lending offset weaker insurance income.
Customer loan growth accelerated in H2 FY25, driven by wholesale lending, while deposits rose mid‑single digits. Credit loss ratio improved to 75–100bps, down from 103bps in FY24, with Personal and Private Banking (PPB), Corporate and Investment Banking (CIB) and Absa Regional Operations: Retail and Business Banking (ARO RBB) showing gains. Operating expenses grew mid‑single digits, lifting cost‑to‑income slightly above 53.2%. RoE is expected around 15% (vs 14.8% in FY24). Africa Regions earnings growth outpaced South Africa, with strong ARO RBB and CIB momentum. Outlook for FY26 anticipates stronger GDP growth in Africa Regions, though Rand appreciation may weigh on reported earnings. “We aim to improve RoE to well within our 16%–19% target range by 2028, supported by stronger revenue growth and cost discipline.” – Management guidance. Results due 10 Mar ’26

Grindrod (GND) Pre-Close Statement Nov ’25 (1623c)

EBITDA: Port & Terminals margin 39% (35% in ’24); Logistics margin 25% (27% in ’24)
Mining commodity markets softened, with average dry-bulk prices down 12%, though iron ore and chrome demand remained firm. Operationally, Maputo exported 13.9mt (13.2mt in ’24), while TCM volumes hit a record 9.1mt. Logistics showed resilience in ships agency and forwarding, though rail was constrained by low locomotive deployment. Net cash improved to R0.2bn from net debt of R0.4bn, despite gross debt rising to R3.7bn due to terminal lease liabilities. Strategic focus has shifted from restructuring to optimising core operations and expanding capacity, including rail and container terminals. “We are poised for growth, with strong balance sheet headroom and a clear pipeline of strategic projects.” – Grindrod leadership. Results due 6 Mar ’26
Thungela Resources (TGA) Trading Statement FY25 (9956c)
 HEPS: Expected ↓40%–50% (vs FY24)
EPS: Expected ↓42%–52% (vs FY24)
HEPS and EPS are both forecast to decline sharply, reflecting weaker export coal prices, lower production volumes, and higher rail constraints.
Export sales volumes were impacted by Transnet rail underperformance, while global thermal coal prices softened from prior highs. Domestic operations remained stable, but logistics bottlenecks constrained export revenue. Cost inflation in mining and energy further pressured margins. Management continues to engage with Transnet and government stakeholders to improve rail performance. Outlook remains cautious given volatile commodity markets and infrastructure challenges. “We remain focused on operational resilience and disciplined capital allocation to sustain shareholder returns despite market headwinds.” – July Ndlovu, CEO.

KAP (KAP) Operational Update & Trading Statement 5M Nov ’25 (188c)

HEPS: >20% increase (vs 17.2c in 1H25)
EPS: >20% increase (vs 16.2c in 1H25)
Revenue: Mixed – PG Bison & Feltex higher; Safripol lower
EBITDA: Higher (vs prior period)
PG Bison achieved full utilisation of its new MDF line, boosting panel sales and exports. Feltex recovered as OEM assembly volumes improved, while Unitrans benefited from agriculture and petrochemical restructuring. Safripol remained weak due to global polymer oversupply, with PET demand subdued. Net finance costs fell, aided by lower debt and extended R2bn revolving credit facility. Frans Olivier assumed the CEO role on 1 Nov ’25, with Dries Ferreira as CFO from Feb ’26. “We invested in future growth, and PG Bison’s new MDF line offers compelling opportunities while debt reduction enhances flexibility.” – Frans Olivier, CEO. Results due 26 Feb ’26
Italtile (ITE) Voluntary Sales Update for 5M to Nov ’25 (899c)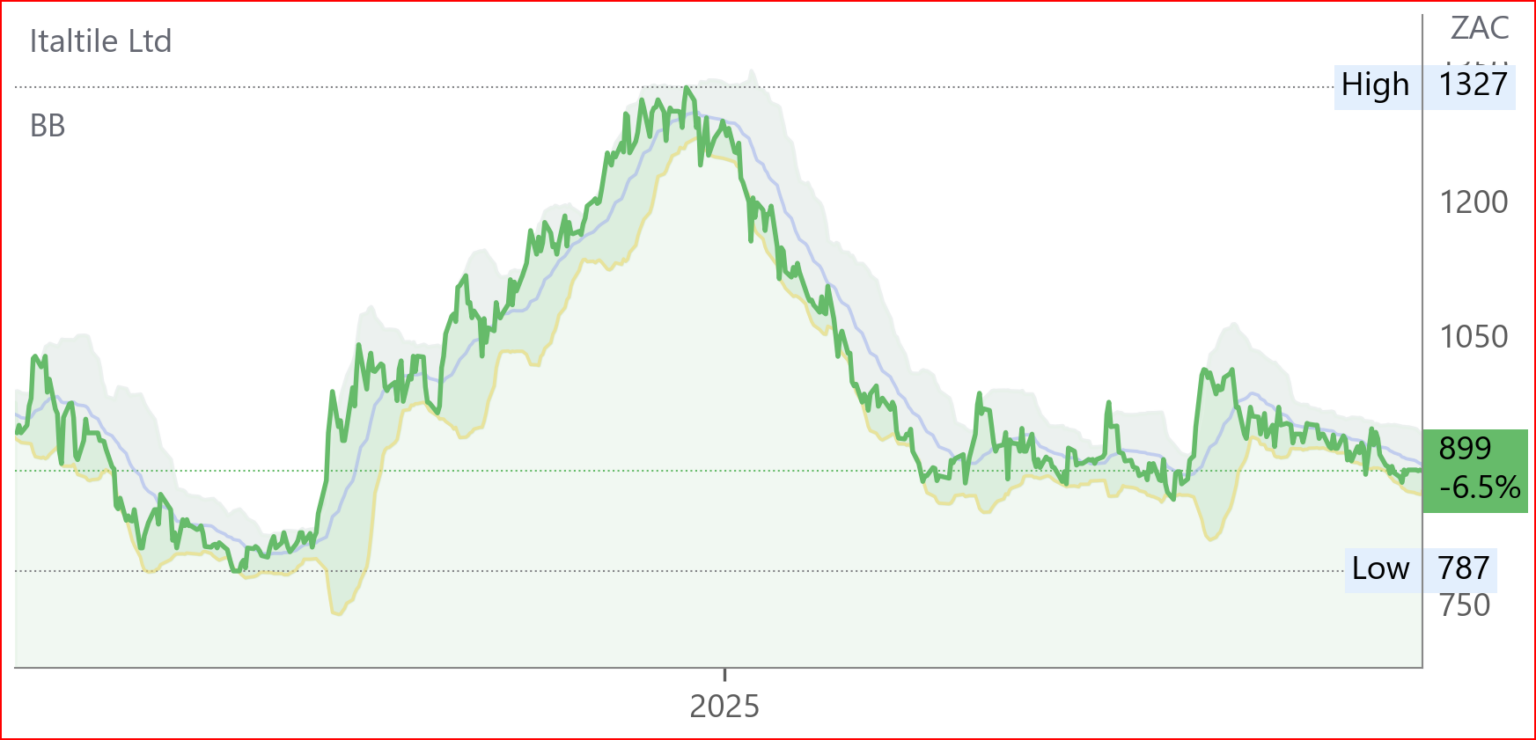
Revenue: Retail turnover ↑1.2% (vs prior period)
Manufacturing sales declined 6.2% due to predatory pricing and reduced imports, while retail turnover grew modestly. Trading conditions remained difficult, with low-priced imports pressuring Ceramic Industries and weak consumer confidence weighing on margins. Retail tile volumes rose as market share improved, though average selling prices fell. Interest rate cuts offered limited relief given sluggish GDP growth and muted building activity. Capacity utilisation at Ceramic Industries dipped slightly, despite efficiency gains. The Group continues to leverage its vertically integrated supply chain, iconic brands, and technology to maintain competitiveness. Outlook anticipates persistent global and local macro-economic challenges, with excess supply and weak demand sustaining margin pressure.
Snippets
Merafe (MRF) announced that Glencore-Merafe Chrome Venture and Eskom signed an MoU to find an energy solution for ferrochrome operations by 28 Feb ’26. The Consultation Process under sections 189/189A will be extended to this date, while Project Phoenix rationalisation continues unaffected. The Extension Period reflects commitment to sustainable beneficiation and ongoing stakeholder engagement. Comment: according to Peter Bruce in the Business Day of 10 December, President Ramaphosa intervened so that Eskom guaranteed to cooperate with Glencore and Samancor and the IDC to achieve a situation whereby Eskom would supply electricity to 24 of the 59 ferrochrome producers that used to operate at 62c/kWh instead of 120c. This would be achieved by Glencore, Samancor and the IDC setting up the equivalent of one of the IPP’s (independent power producers) used for renewable energy. This entity would supply coal at cost to Eskom which would burn it in one of its unused power stations such as Grootvlei, Duvha and Hendrina and then supply the resultant electricity to the ferrochrome producers. Given that the 25 excluded smelters are likely to have been those that were out of production for some years already, this means that a substantial proportion of the Glencore-Merafe JV production will be maintained and restored. Moreover, the JV is already a producer of coal so would be able to supply to the IDC “IPP” albeit at lower prices overall than it currently obtains for those coal tonnages that are exported. Net-net, however, this arrangement is likely to benefit the Glencore-Merafe JV materially.
Mr Price (MRP) will acquire 100% of NKD Group, a European value and homeware retailer, for up to €487m (≈R9.66bn). NKD operates 2,108 stores across seven countries, generating €685m sales in FY24. The deal expands Mr Price’s footprint beyond Africa, adding scale and growth runway. Closing is expected in Q2 ’26, subject to approvals.