
Global Indices

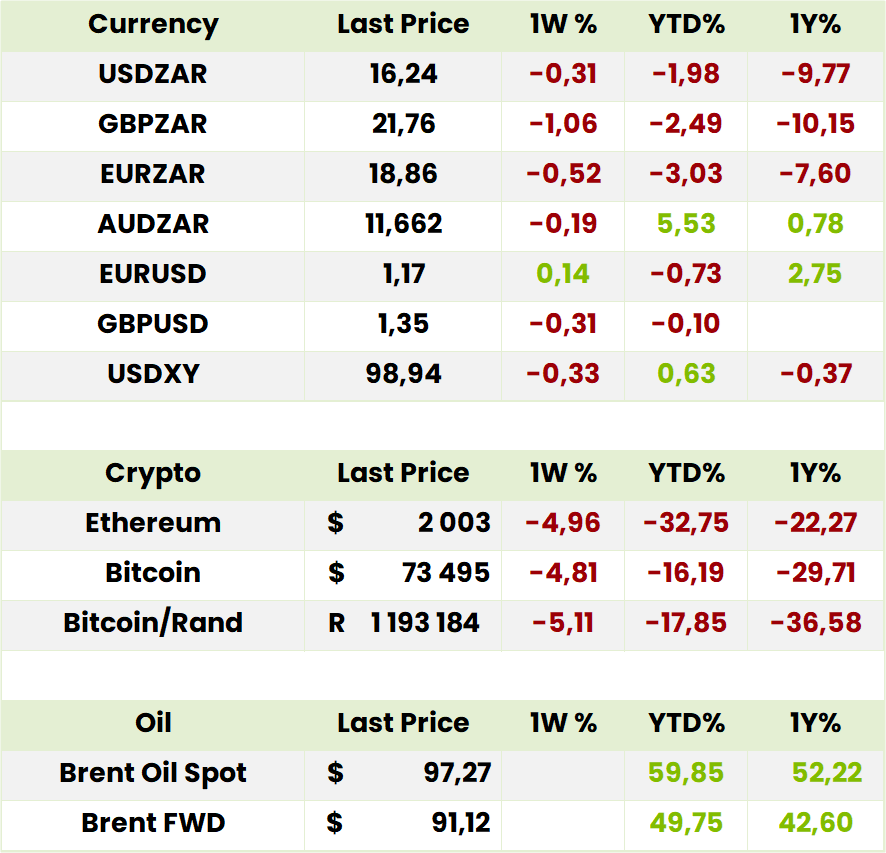
Currencies, Crypto & Commodities

SA Indices

SA Upcoming Indicators & Dividends



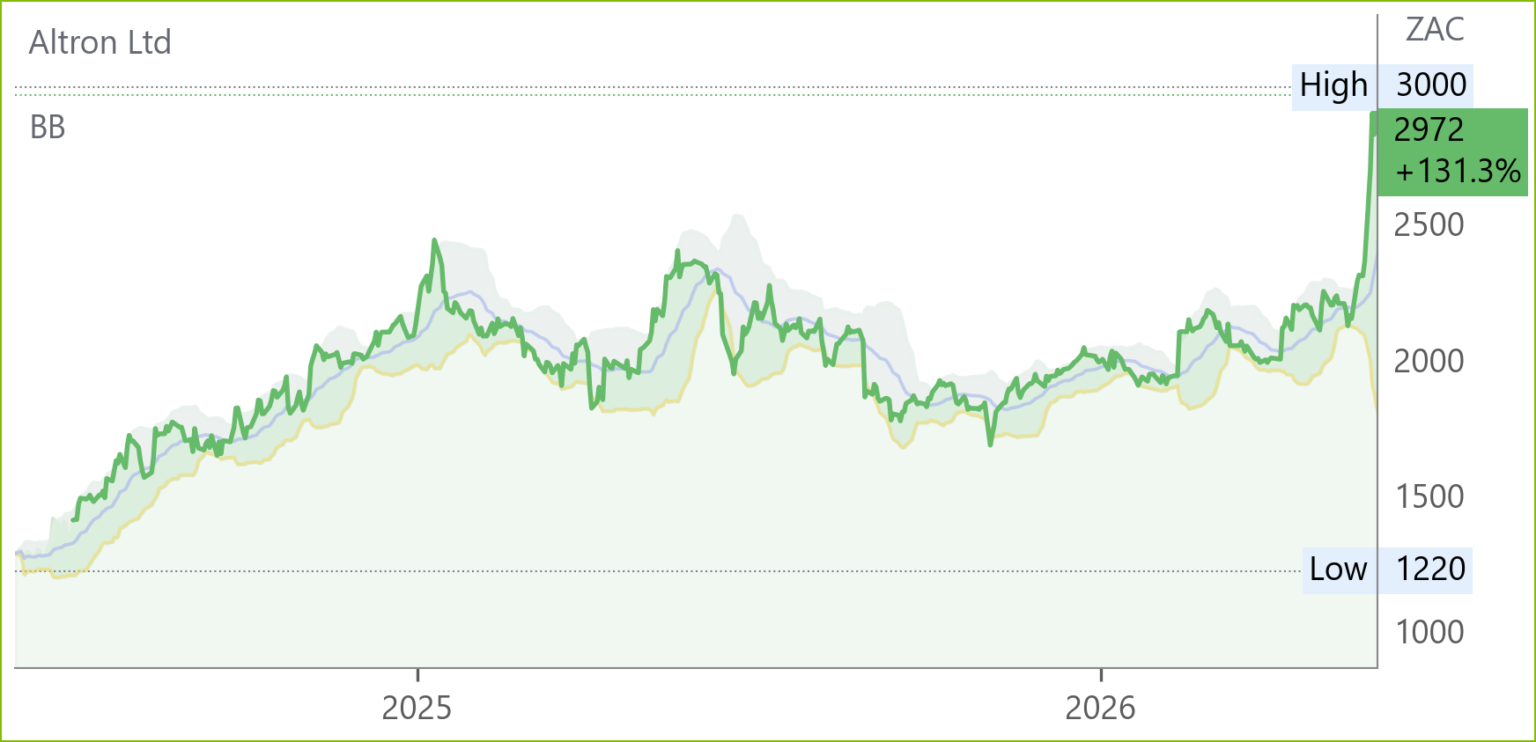
Altron (AEL) Financial Results FY26 (2972c)
HEPS: 239c (↑34% from 178c)
EPS: 210c (↑35% from 156c)
Operating Profit: R1.2bn (↑25% from R972m)
Revenue: R9.6bn (↑1% from R9.5bn)
EBITDA: R2.0bn (↑10% from R1.8bn)
Dividend: 120c ordinary dividend (↑33% from 90c) plus 120c special dividend
HEPS and EPS growth above 30% was driven by strong momentum in the Platforms segment (Netstar, FinTech, HealthTech), which contributed 91% of EBITDA and 95% of operating profit. Netstar crossed R1bn EBITDA, while Altron FinTech doubled operating profit over three years to R561m. Document Solutions delivered a turnaround with R98m operating profit. Cash generation remained robust at R1.9bn, supporting ungeared balance sheet strength.
“FY26 marks the successful conclusion of our Accelerated Growth phase. As we enter Transformative Growth, Altron has transformed into a multi‑platform business uniquely positioned to drive sustainable growth in South Africa’s digital economy.” – Werner Kapp, CEO.
Comment: last year Kapp said Altron’s “strategy was to become the leading platform and IT services business in our chosen markets” and “today Altron is firmly centred at the centre of the digital revolution” and was operating in industries that were undergoing rapid transformation and growing at double digit rates. While Netstar grew subscribers from 1.38 million in FY23 to 2.21 million and Karooooo’s Cartrack now has 2.7million in 20 countries the two contestants can certainly be said to be in the same ballpark. In any event, however, Kapp’s remarks are not out of line in the light of the group’s performance as a whole and it would seem the gap between Altron’s rating on an 11.5x PE and 4.4% DY (excluding the 120c special) and Karooooo’s 24.1x PE and 2.4% DY should close somewhat despite the latter’s Nasdaq listing. Bottom line: Altron can safely be bought.
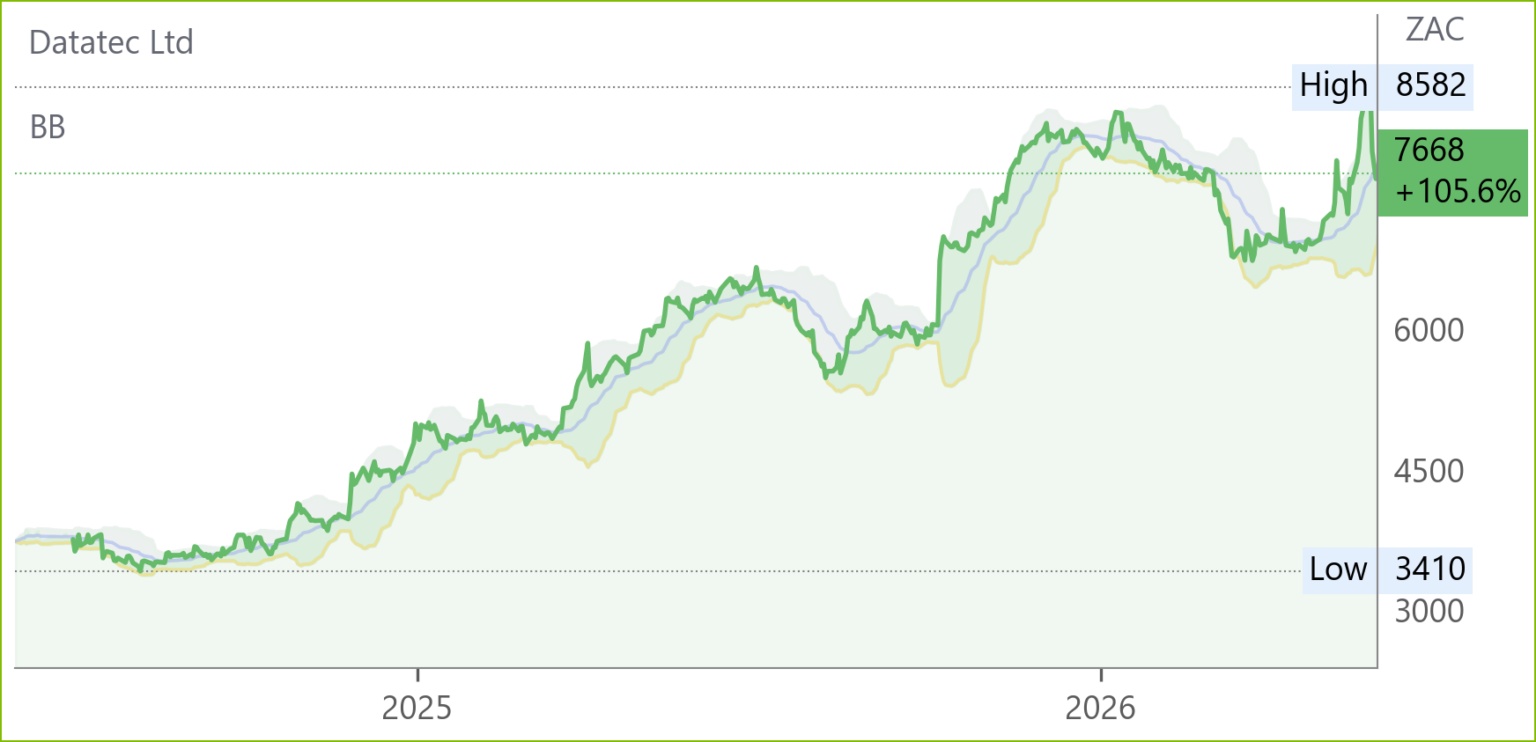
Datatec (DTC) Financial Results FY26 (7668c)
HEPS: 39.9 USc (↑56.5% from 25.5 USc)
EPS: 39.6 USc (↑54.1% from 25.7 USc)
Operating Profit: Profit after tax US$91.8m (↑55.1% from US$59.2m)
Revenue: US$3.67bn (↑3.3% from US$3.55bn)
Gross Profit: US$997.8m (↑9.6% from US$910.3m)
EBITDA: US$269.1m (↑21.6% from US$221.3m)
Dividend: 225c final dividend (↑12.5% from 200c)
HEPS and EPS growth above 50% was driven by strong performances at Westcon International and Logicalis International, with Logicalis Latin America also improving. Gross invoiced income rose 9.3% to US$8.46bn, reflecting resilient demand for ICT solutions. Net debt reduced 10.4% to US$46.7m, while NAV increased 3.7% to US$540.3m.
“AI adoption is increasing IT complexity, fuelling demand for infrastructure and deep technical expertise. As a digital channels organisation, Datatec is well‑positioned to take advantage of these dynamics and expects continued strong performance in FY27.” – Jens Montanana, CEO.
Comment: on a 12.1x PE and 5.1% DY the stock is way too cheap, possibly as a result of decades of desultory performance back in the day. Just as one indicator of what has changed Montana points out nearly 70% of business now is in effect repeat or annuity as against one capex per annum previously. In addition, it may well be that the acquisitions are accretive.
Reunert (RLO) Interim Results for 6M Mar ‘26 (6458c)

HEPS: 185c (↓22% from 238c)
EPS: 185c (↓24% from 243c)
Operating Profit: R453m (↓23% from R585m)
Revenue: R6.3bn (↑1% from R6.2bn)
Dividend: 90cps (interim dividend declared)
Operating profit contracted due to weaker Electrical Engineering performance, FX losses in Zambia, and remeasurement of share-based plans. ICT delivered stable earnings with improved margins, while Applied Electronics grew operating profit 41% on strong Defence Cluster execution. Net cash rose to R383m, supported by disciplined liquidity management.
Strategic acquisitions include Silversoft (enterprise software) and a European fuze manufacturing JV in Slovakia. Outlook highlights recovery in Electrical Engineering, ICT growth from restructuring, and sustained demand in Defence, though Rand strength may weigh on H2.
“Reunert is undertaking a strategic refresh to sharpen execution, strengthen cash discipline, and prioritise growth areas with the strongest potential to create value.” – Anthonie de Beer, CEO.
Comment: not a bad idea since the share price is short of where it was 10 years ago! The CEO, who took office on 1st March, commits to focus on growth areas with control of the Slovakian fuse manufacturing operation being a promising move in the Allied Electronics Defence division which boosted operating profit by 41% despite delays in sales to Middle East customers due to hostilities there, and contributed 24% to the total. At the Capital Markets Day in September, he will also elaborate on how the group will participate in the Super Cycles which he sees as the Energy Transition, AI and Defence. All of this will take time and, for now, the share is correctly priced.
4Sight (4SI) Financial Results FY26 (78c)

HEPS: 10.73c (↑46.1% from 7.35c)
EPS: 9.89c (↑34.7% from 7.34c)
Operating Profit: R71.7m (↑45.8% from R49.2m)
Revenue: R1.16bn (↑16.3% from R1.00bn)
Dividend: 3c per share (final, declared)
Revenue growth of 16% was supported by strong demand for digital transformation solutions, while operating profit rose 46% on improved margins. HEPS outpaced EPS due to prior-year adjustments, reflecting underlying earnings strength. The maiden dividend of 3c per share underscores confidence in cash generation. Outlook highlights continued investment in AI-driven enterprise solutions and expansion into new verticals.
Comment: Another pleasing result from an up-and-coming IT services business. This company listed on Alt-X and transferred to the Main Board in 2025. Although still small (and overlooked by institutions) it operates in attractive sectors. Revenue growth has been consistent and margins have been expanding. HEPS jumped by 46%, and the declaration of a Dividend makes the valuation more attractive. Buy at currently levels.

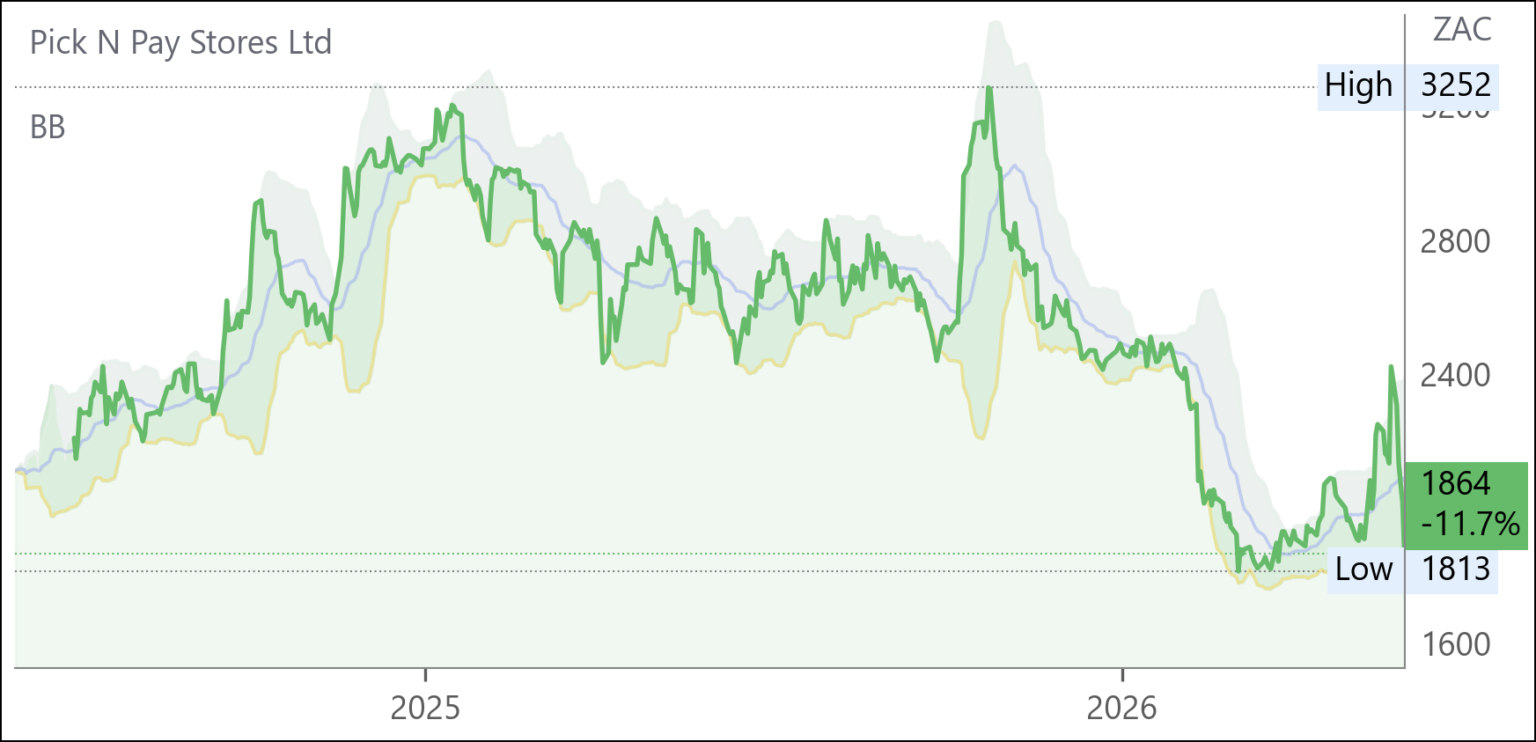
Pick n Pay (PIK) Financial Results for FY26 (1864c)
HEPS: (52.58c loss) (↑14.6% from -61.54c)
EPS: (99.17c loss) (↑10.6% from -111.01c)
Operating Profit: R1.69bn (↓4.2% from R1.76bn)
Revenue: R120.3bn (↑3.4% from R116.3bn)
Gross Profit: R22.6bn (↑5% from R21.5bn)
Operating profit fell modestly, but EPS and HEPS losses narrowed. Revenue growth was driven by Boxer’s 12.3% turnover increase, offset by a 1.6% decline in Pick n Pay supermarkets due to an estate reset, meaning the group’s restructuring of its store footprint through selected store closures, conversions, lease actions, refurbishments, and a tighter focus on more profitable locations. EBITDA contraction was influenced by higher trading expenses from Boxer’s rollout.
Boxer delivered strong growth, while Pick n Pay management pushed out profit break-even to FY29, citing elevated fuel costs and geopolitical risks impacting food inflation.
“Positive progress is being made in improving the customer experience, which is our lifeblood.” – Sean Summers, CEO.
Comment: in pushing the targeted date for profitability out to FY29 instead of FY28 Sean Summers has reiterated that he doesn’t want to go for a quick win in three years which would unravel in five years’ time. He wants to build a lasting foundation for a company which, in 2024 was on the brink of collapse. Much has already been achieved to restore profitability in a low margin industry but, as evidenced by the backlash against moves to bring staff costs in line with the rest of the industry, much more remains to be done. Although there is a case to be made for buying Pick n Pay to get Boxer at a discount of 22% we would caution against this at least until the outlook for fuel prices improves as both parent and subsidiary will be significantly affected, especially if, as is likely, they delay in passing on the costs thereof.

Pepkor (PPH) Interim Results for 6M Mar ‘26 (2167c)

HEPS: 93.1c (↑10.3% from 84.4c)
EPS: 93.3c (↑12.1% from 83.2c)
Operating Profit: R6.3bn (↑9.4% from R5.8bn)
Revenue: R54.8bn (↑13.2% from R48.5bn)
Gross Profit: Margin 40.8% (↑170bps)
EBITDA: R9.1bn (↑11.6% from R8.2bn)
NAV: 1 761c per share (↑7.2% from 1 642c)
Trading momentum accelerated in Q2, supported by 89 new store openings and acquisitions adding 541 stores. Online sales grew 30.9%, while membership expanded to 17m. Avenida in Brazil recovered strongly, and PEP Africa delivered 9.3% like‑for‑like growth. Financial services doubled profits, with FoneYam cellular rentals up 32% and approval obtained to establish a bank. Informal market platform Flash grew throughput 20.3% to R34.7bn, supporting 176k traders.
Outlook remains cautious amid challenging conditions, but management targets 200 new stores in FY26, further acquisitions, and scaling of financial services and informal market platforms. Comment: despite broadening its offering over the years the share price is still below its pre-covid peak of 2540c nearly ten years ago. Growth since the covid nadir of 970c has been steady with expectations enhanced by the move to leverage its 32 million customers and 10 million digital clients in its moves to set up a bank. New entrants to banking include Old Mutual and Sanlam with Go-Thyme and all of them will take time to get traction albeit not as long as Discovery which, of course, was aiming at a different segment. The share is, nevertheless, correctly priced for those investors who want to make sure they do not miss out when banking becomes a meaningful contributor.
Lewis (LEW)* Financial Results for FY26 (8810c)
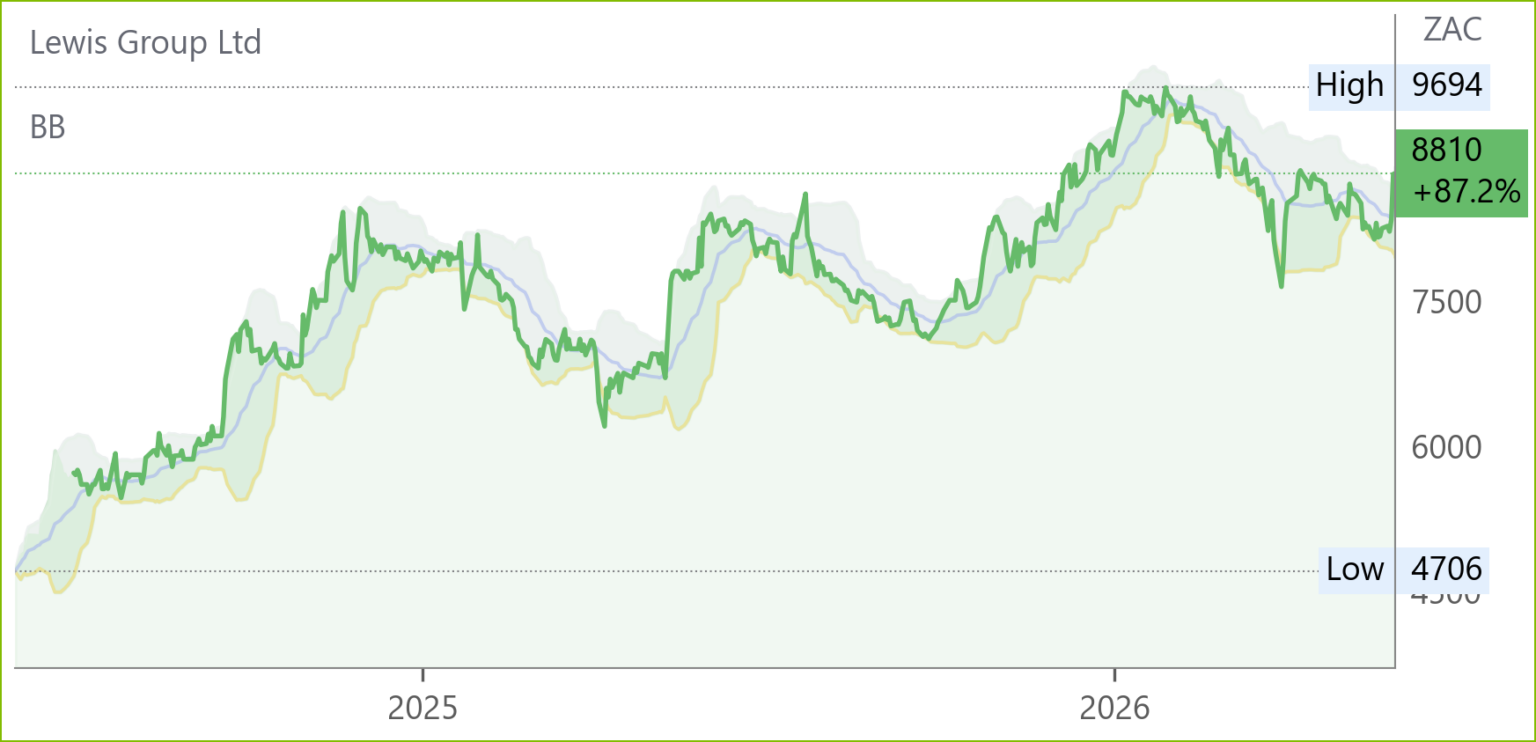
HEPS: 1753c (+18.3% vs 1482c)
EPS: 1646c (+13.0% vs 1456c)
Operating Profit: R1.3bn (+12.8% vs R1.15bn)
Revenue: R10.3bn (+11.1% vs R9.3bn)
Gross Profit: 43.7% margin (+30bps vs 43.4%)
Dividend: 897c per share (↑12.1%), incl. final 560c
Headline earnings rose 18.4% to R909m, supported by merchandise sales growth of 7.3% and a 15.2% expansion in the debtors’ book. Store footprint reached 976 outlets, with 58 net openings, including 36 Real Beds stores. Credit sales grew 9.6%, now 69.4% of merchandise sales, while customer accounts increased by 77,000. Operating margin expanded to 23.8%. Net borrowings rose to R1.23bn, lifting gearing to 40%, but remain within board risk appetite. CEO Johan Enslin highlighted resilience in constrained consumer markets and affirmed plans to open 40 new stores in FY27.
Comment: while the share price has increased fivefold since its post covid nadir of 1730c (the pre-covid peak was R100 eleven years ago) earnings and dividends have kept pace with the latter growing from 328cps in FY21 to 897cps. What has not kept pace with this growth is the rating which remains stubbornly low. This is due to the currently low market cap of R4.6bn which is partly due to artificial constraints for various categories of institutional and other investors. This will change over time thereby enabling private investors not only to enjoy a starting DY of around 10% and the ensuing double digit growth but also a re-rating bonanza down the line. Although Lewis is currently yelling blue murder to the Competition Commission as regards the prosed merger of Shoprite and Pepkor furniture interests, we do not believe this will detract significantly from Lewis’s ongoing growth and might even provide opportunities.

Tsogo Sun (TSG) Financial Results FY26 (759c)
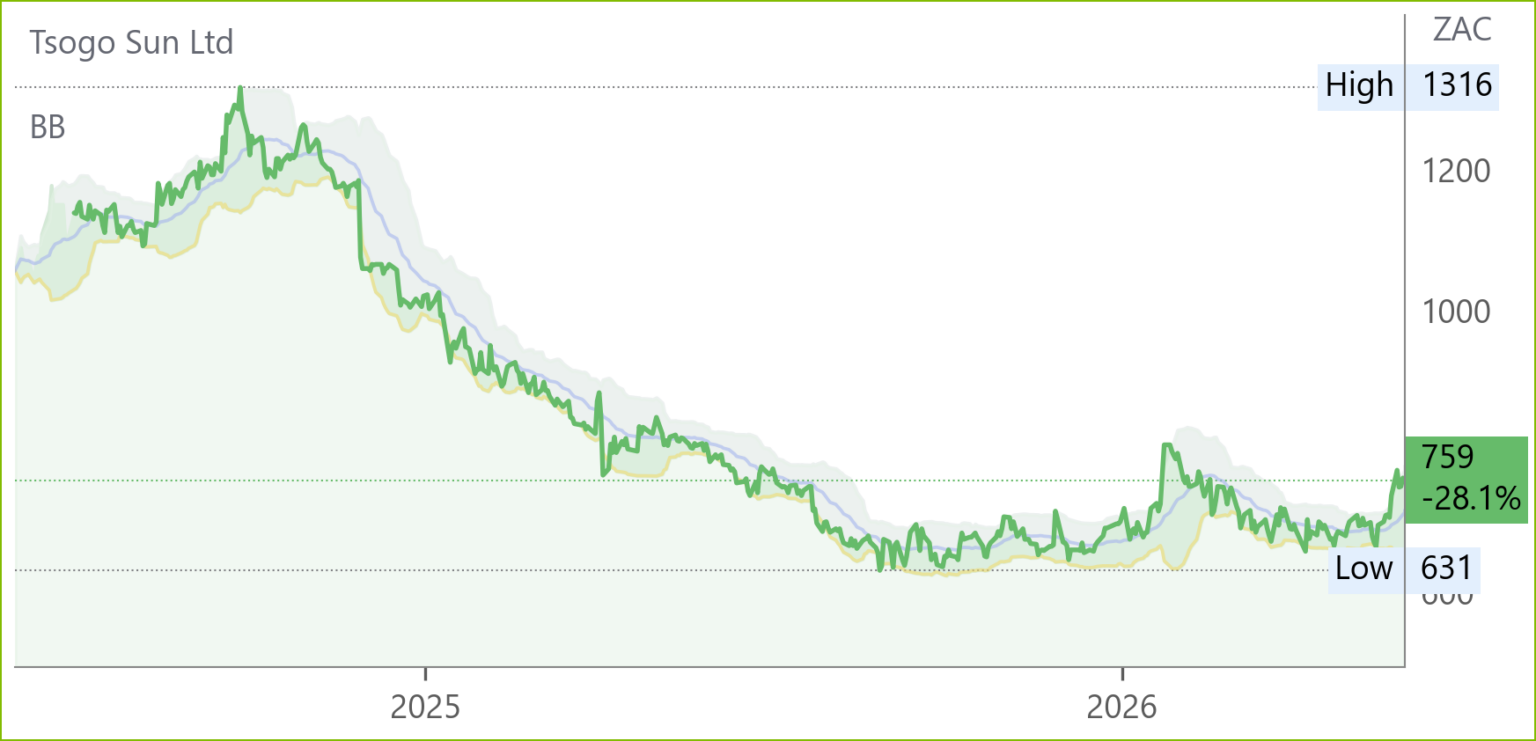
HEPS: 153c (↑8% from 141c)
EPS: 126c (↑5% from 120c)
Revenue: R11.1bn (flat vs R11.1bn)
EBITDA: R3.5bn (flat vs R3.5bn)
Dividend: 30c final dividend (unchanged)
Headline earnings rose 7% to R1.6bn, supported by stable EBITDA and disciplined cost management. Net interest‑bearing debt reduced 10% to R6.5bn, lowering the covenant ratio to 1.92x EBITDA. Share buy‑backs of R438m were executed during the year, enhancing shareholder returns. The dividend was maintained at 30c per share, with payment scheduled for 27 Jul ‘26. Outlook commentary highlights a resilient earnings base, strengthened balance sheet, and continued focus on shareholder value creation.
Netcare (NTC) Interim Results for 6M Mar ‘26 (1768c)
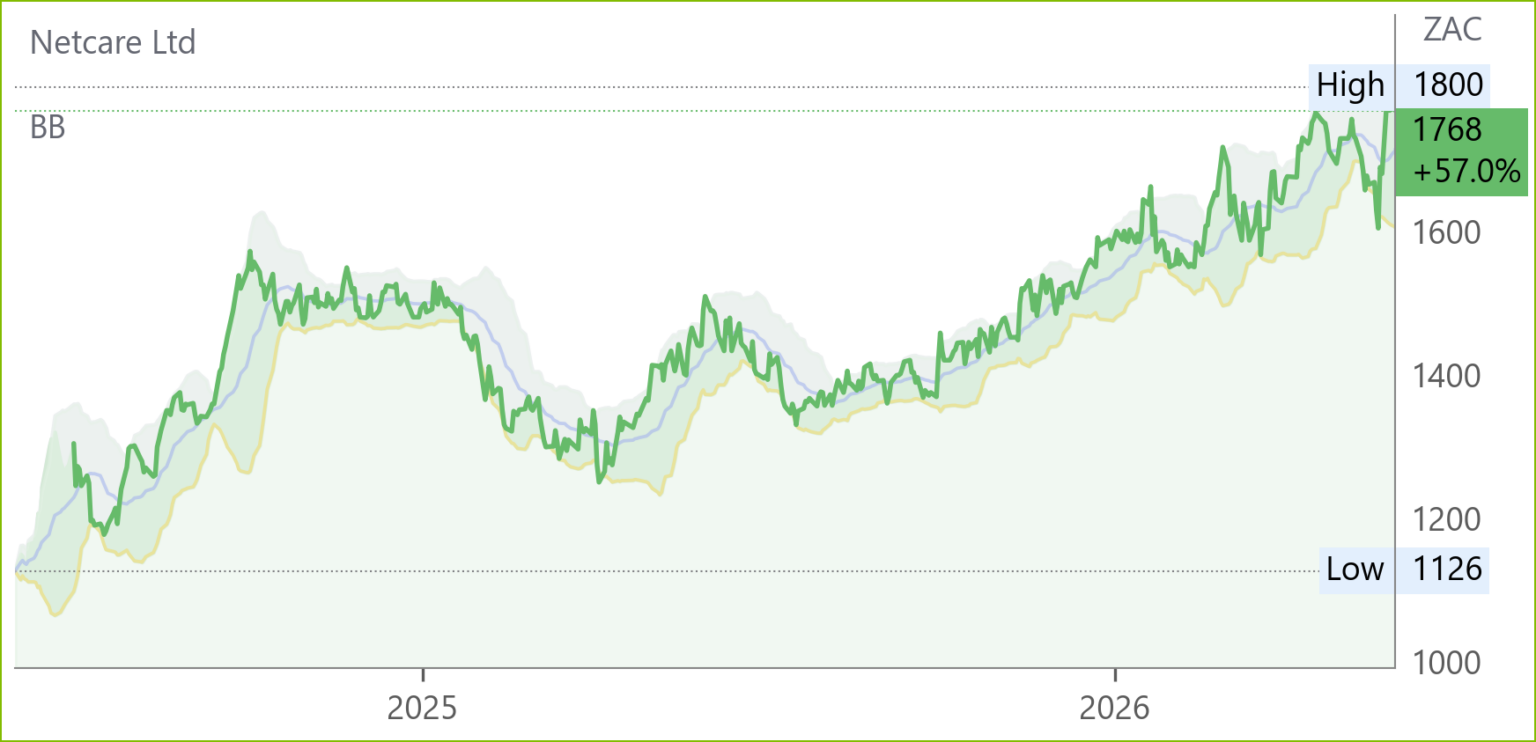
HEPS: 71.6c (↑21.2% from 59.1c)
EPS: 70.6c (↑19.1% from 59.3c)
Operating Profit: R1.786bn (↑7.4% from R1.663bn)
Revenue: R13.281bn (↑4.8% from R12.677bn)
EBITDA: R2.501bn (↑6.6% from R2.347bn)
Dividend: 44c interim dividend (↑22.2% from 36c)
Earnings growth was supported by higher patient volumes and improved operational efficiencies, with profit for the period rising 11.9% to R924m. Net debt increased to R6.1bn, reflecting investment in infrastructure and technology. Management emphasised strong cash generation and a disciplined capital allocation framework.
“FY26 interim results demonstrate the resilience of our healthcare platform and our commitment to delivering sustainable shareholder returns.” – Dr Richard Friedland, CEO.
Comment: in contrast to its peer below, Netcare bottomed out in December 2020 at 1165c after peaking in 2023 at R43ps and commenced a steady albeit slow recovery with adjusted Heps of 67.4c in FY21 doubling to 137.2c in FY 25. Similar sector considerations apply as those mentioned below with regard to peer Life Health Care. Both at an industry and company level it is significant that co-founder and leader of Netcare for over two decades, Dr Richard Friedland, will be succeeded by long serving executive Melanie da Costa who is CFA and, together with Dr Friedland, has been playing a role in industry matters such as NHI.
Life Healthcare (LHC) Interim Results for 6M Mar ’26 (1070c)

HEPS: 55.1c (>100% vs -155.8c)
EPS: 52.8c (>100% vs -155.2c)
Operating Profit: +8.4% before non-trading items
Revenue: R12.4bn (+2.4% vs H1 ’25)
EBITDA: R2.6bn (+5.2% vs H1 ’25)
Dividend: 23c interim (↑9.5%)
Normalised EPS rose 8.4% to 53.1c, reflecting solid operational performance despite the impact of a funder placed under curatorship. Net debt/EBITDA remains healthy at 0.93x, with R1.8bn undrawn facilities. Expansion continues with 87 new acute beds, three PET-CT sites, and the 140-bed Paarl Valley Hospital under construction. Diagnostics growth and cost optimisation (R400m savings over three years) underpin strategy. Recruitment of 140 specialists is planned for FY26. CEO Peter Wharton-Hood emphasised resilience and thanked staff for their dedication to patient care. Comment: it is still a little early to tell but there are signs that the stock might be about to commence a slow reversal of the 12 year share price decline since R45 in 2014 and we concur with the CEO who in effect is saying “when we supply the beds and specialists, the patients will come!” This does of course presuppose that a “deal” will be struck between as regards National Health Insurance so as not to make those specialists emigrate. Meanwhile the stock can be held for yield and steady growth on the basis that sanity will prevail.

Reinet (RNI)* Financial Results FY26 (49014c)

Dividend: EUR 0.435 per share (↑17.6%, proposed)
NAV: EUR 6.6bn (↓4.5% from EUR 6.9bn); NAV per share EUR 36.31 (↓4.5% from EUR 38.04)
Net asset value declined 4.5% due to portfolio revaluations, despite strong dividend inflows of EUR 303m from Pension Insurance Corporation (PIC). Reinet sold its entire PIC stake to Athora Holding for EUR 3.3bn, reshaping its portfolio. Commitments of EUR 306m were made to new and existing investments, with EUR 109m funded. Proposed dividend uplift reflects confidence in liquidity and capital allocation. Outlook highlights disciplined investment strategy and long-term NAV growth, with compound annual growth of 8.3% since 2009. “Reinet’s strong liquidity position provides the flexibility to evaluate new investment opportunities selectively, with a focus on long-term value creation and capital preservation,” said Johann Rupert, Chairperson.
Comment: the discount to NAV (at ZAR 18.93/EUR) of 31% is of interest to investors needing a solid rand hedge content in their portfolios. Needless to say, the 83% cash and liquid assets content provides an additional hedge to investors anticipating a global markets shakeout.
Stefanutti Stocks (SSK) Financial Results FY26 (669c)
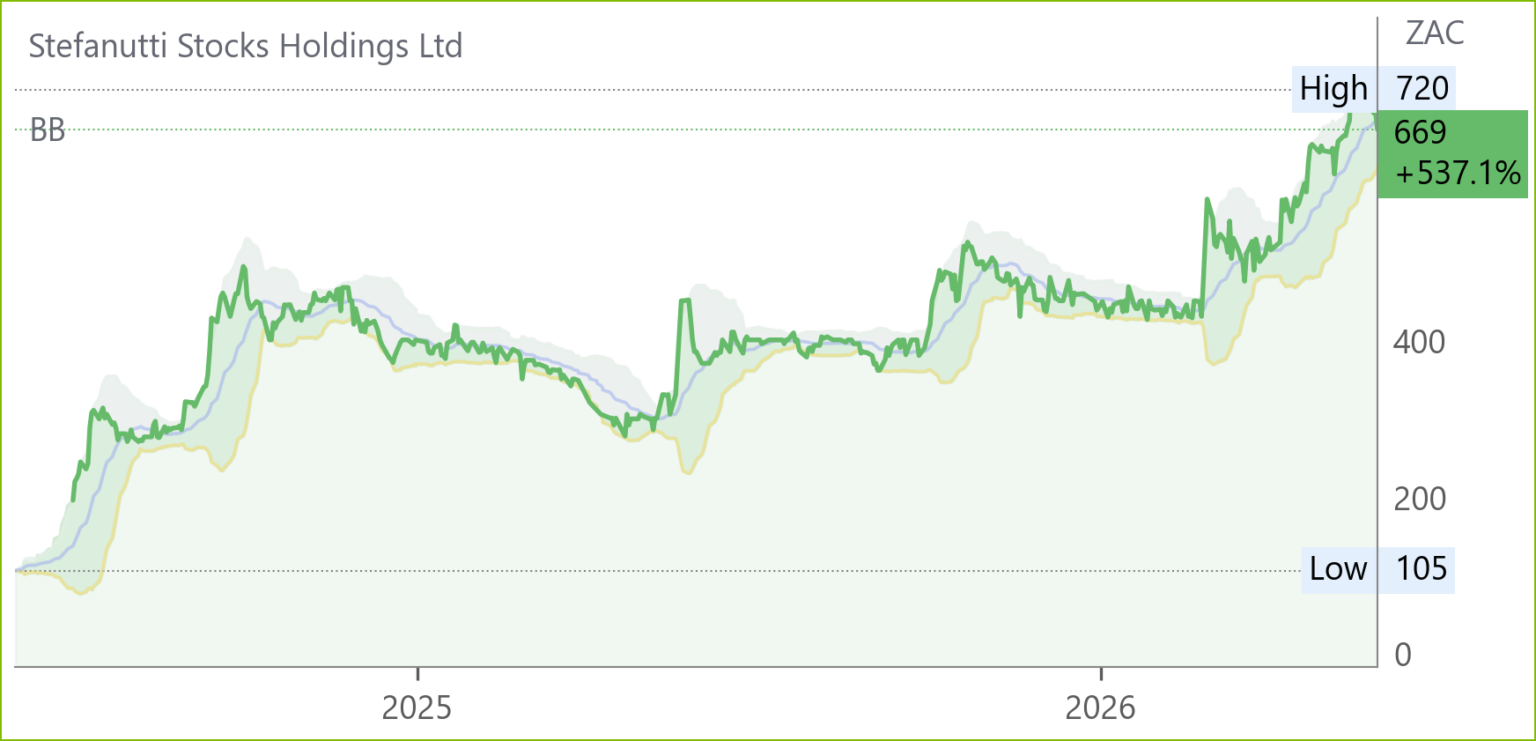
HEPS: 359.26c (↑229% from 109.36c)
EPS: 370.44c (↑371% from 78.60c)
Operating Profit: R689m (↑107% from R333m)
Revenue: R7.84bn (↑2% from R7.66bn)
EBITDA: R852m (↑99% from R428m)
Dividend: Nil (unchanged)
Earnings surged due to the R580m settlement with Eskom on the Kusile Power Project, which contributed R448m to revenue and R388m to operating profit. Normalised EBITDA excluding settlement effects was R464m. The order book doubled to R17.2bn, with R6bn outside South Africa. Net current liabilities improved to R133m (vs R1.3bn in FY25), while accumulated losses reduced to R386m. Safety metrics improved, with LTIFR at 0.06. Directors confirmed adequate resources for going concern, supported by a new R850m Standard Bank facility and strong cash flows.

Coronation (CML) Interim Results for 6M Mar ‘26 (4261c)

HEPS: 195.1c (↓5% from 205.1c)
EPS: 218.0c (↑6% from 205.1c)
Revenue: R2.088bn (↑3% from R2.037bn)
Dividend: 203c interim dividend (↑1.5% from 200c)
Revenue growth was modest, while EPS rose 6% supported by fair value gains, but HEPS declined 5% due to the exclusion of investment seeding impacts. Fund management EPS increased 2% to 203.7c, reflecting core operating performance. Interim dividend was lifted to 203c, maintaining a consistent payout policy. Outlook commentary points to disciplined capital allocation and resilience in asset management earnings despite market volatility.
Comment: the share price is way below pre-covid highs, no doubt as a result of intensifying competition, but the 10.7% trailing DY has attractions as a diversifier for a dividend portfolio with likely benefits on a resumption of SA economic growth.
Zeda (ZZD) Interim Results for 6M Mar ‘26 (1500c)

HEPS: 201c (↑6.1% from 189.7c)
EPS: 201c (↑6.2% from 189.4c)
Operating Profit: R841m (↓0.6% from R846m)
Revenue: R5.544bn (↑3.2% from R5.372bn)
Dividend: 80c interim dividend (↑45.5% from 55c)
NAV: 1 846c per share (↑9.9% from 1 680c)
Revenue growth was driven by Leasing (+7.5%) and Car Sales (+12.9%), offset by weaker Car Rental. Greater Africa contributed 21.3% of leasing revenue, with strong gains in Ghana, Zambia and Lesotho, though Namibia and Mozambique weighed on performance. Finance costs fell 8.9% due to funding diversification and lower interest rates, while net debt reduced to R6.24bn. ROE was 21.2% and ROIC 12.3%, exceeding WACC of 10.8%.
Outlook highlights sustained leasing momentum, recovery in Namibia, and disciplined expansion into West Africa under an asset‑light model.
Sector peers for comparison: Motus (MTH), Combined Motor Holdings (CMH), Super Group (SPG).
eMedia Holdings (EMH) Financial Results FY26 (226c)
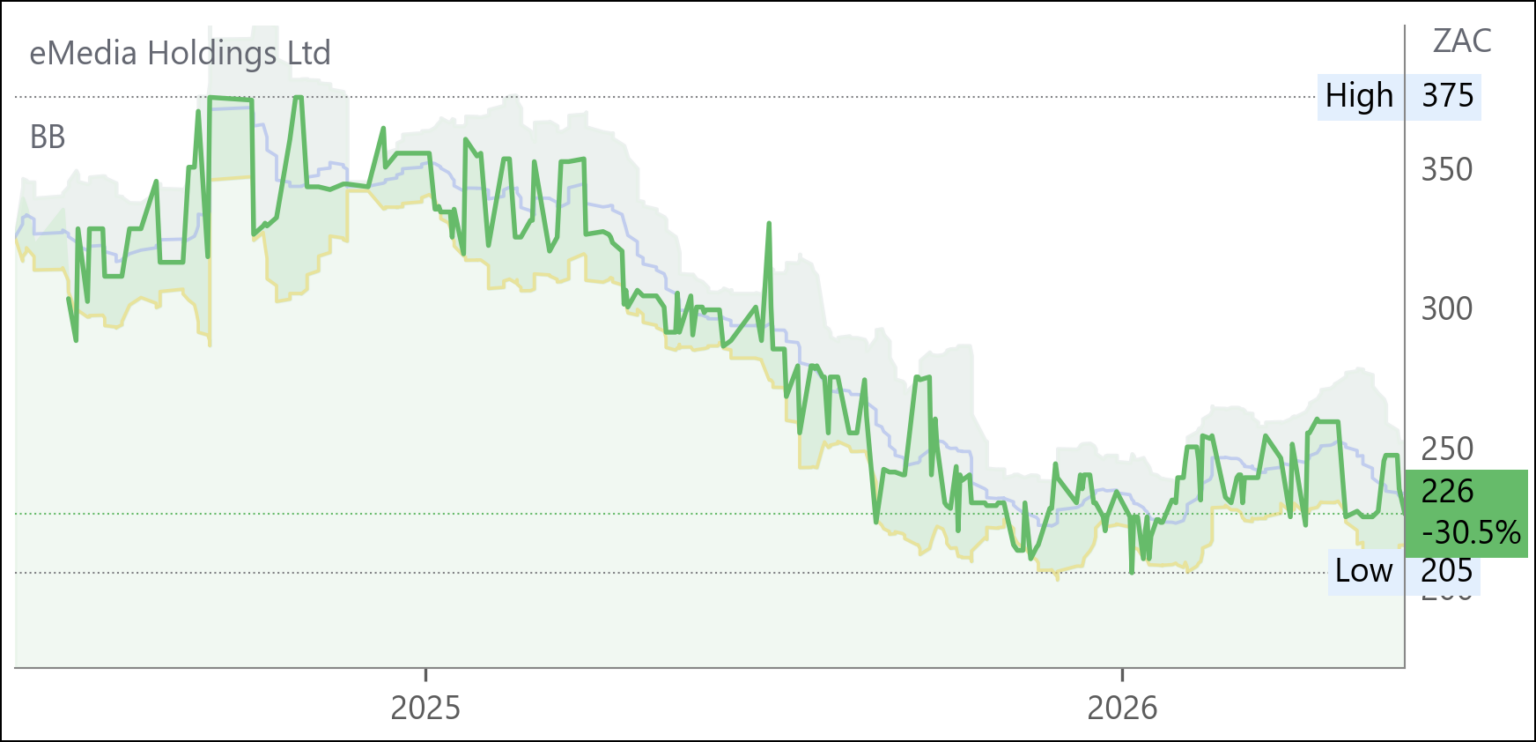
HEPS: 43.48c (↓4.7% from 45.63c)
EPS: 44.10c (↓4.1% from 45.99c)
Operating Profit: R405m (↓8.3% from R442m)
Revenue: R2.99bn (↓5.2% from R3.16bn)
Dividend: 15c per share (final, unchanged)
NAV: 668c per share (↑1.1% from 661c)
Profit resilience was achieved despite an 8.7% decline in the television advertising market, with cost savings in transponder fees, legal expenditure, and foreign content commitments supporting margins. Advertising revenue contraction limited top-line growth, but profitability remained steady. Dividend maintained at 15c reflects consistent shareholder returns. Outlook highlights continued focus on cost discipline and navigating macroeconomic pressures. Sector peers: Primedia (PMD), Caxton & CTP Publishers (CAT)

Trading Statements & Updates
Sygnia (SYG)* Trading Statement for 6M Mar ‘26 (3300c)

HEPS: 135.8c–141.5c (↑20%–25% from 113.2c)
Headline earnings per share are expected to rise by 20%–25% for the six months ended Mar ‘26, reflecting resilient performance in asset management and investment administration. Diluted HEPS is similarly guided higher, at 134.3c–139.9c versus 111.9c in the prior period. The uplift underscores strong fee income growth and operational efficiency. Interim results due 8 Jun ‘26.
Omnia (OMN) Trading Statement FY26 (10142c)

HEPS: 824c – 866c (↑17%–23% from 704c)
EPS: 837c – 879c (↑21%–27% from 692c)
Earnings growth reflects robust execution of strategy, strong cash generation, and improved financial performance. Net cash position at Mar ‘26 was R1.678bn (vs R1.770bn in FY25), underscoring disciplined liquidity management. EPS and HEPS increases above 20% highlight resilient demand across agriculture and mining solutions, supported by margin expansion.
Management noted that adjustments may arise from year‑end closure, but headline momentum remains intact. Outlook points to continued cash discipline and strategic delivery underpinning long‑term shareholder value. Results due 8 Jun ‘26

Telkom (TKG) Trading Statement FY26 (6212c)
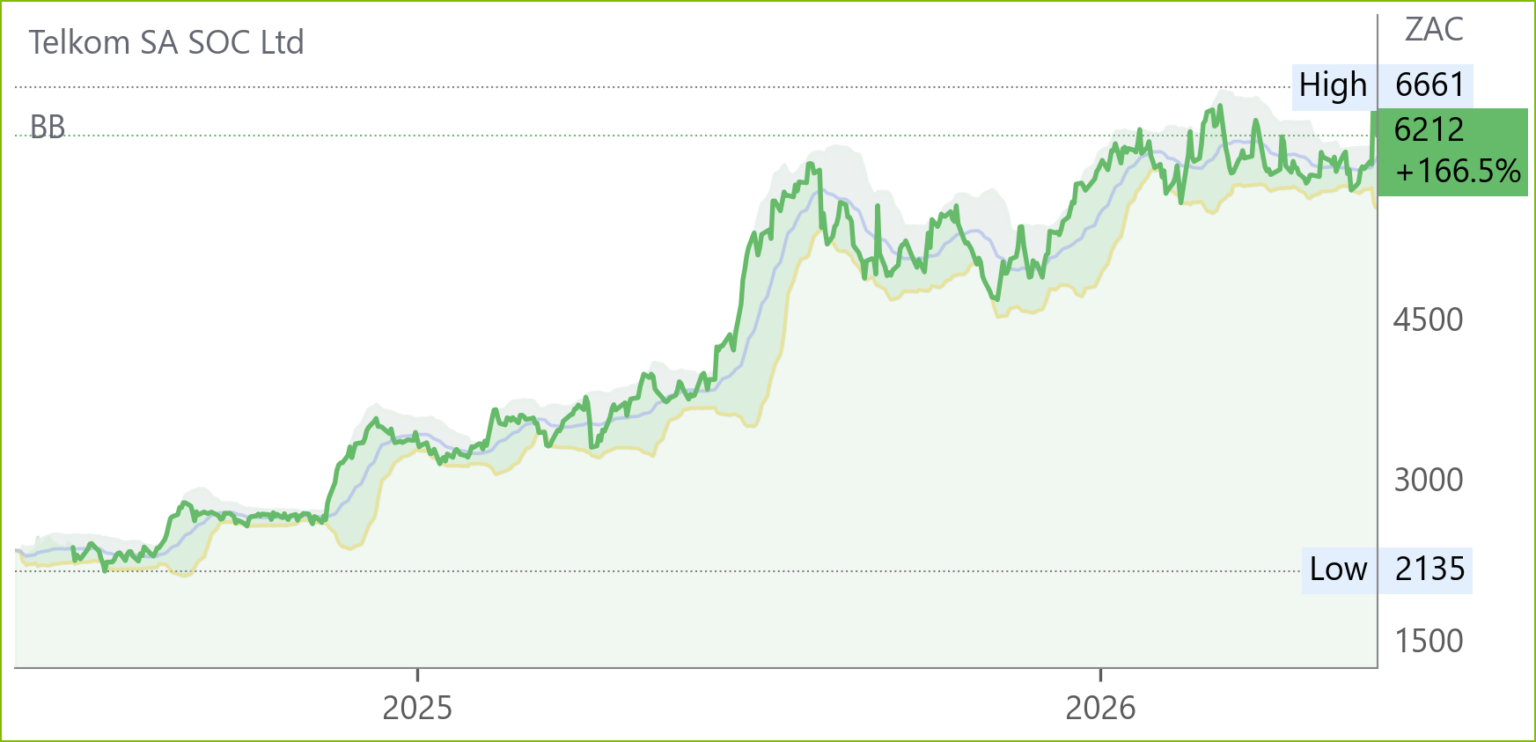
HEPS: 678c–725c (↑45%–55% from 468c)
EPS: 679c–736c (↑20%–30% from 566c)
Earnings growth was driven by strong operating performance, structural cost optimisation, and lower finance charges from reduced debt levels. Prior year results were negatively impacted by once-off expenses including the derecognition loss of the Telkom Retirement Fund (R451m) and restructuring costs (R117m). Gains on property disposals were lower in FY26 (R194m vs R654m in FY25). Total operations EPS declined due to the prior year’s disposal of Swiftnet, classified as discontinued. Results due 2 Jun ‘26.
PPC (PPC) Trading Statement FY26 (694c)
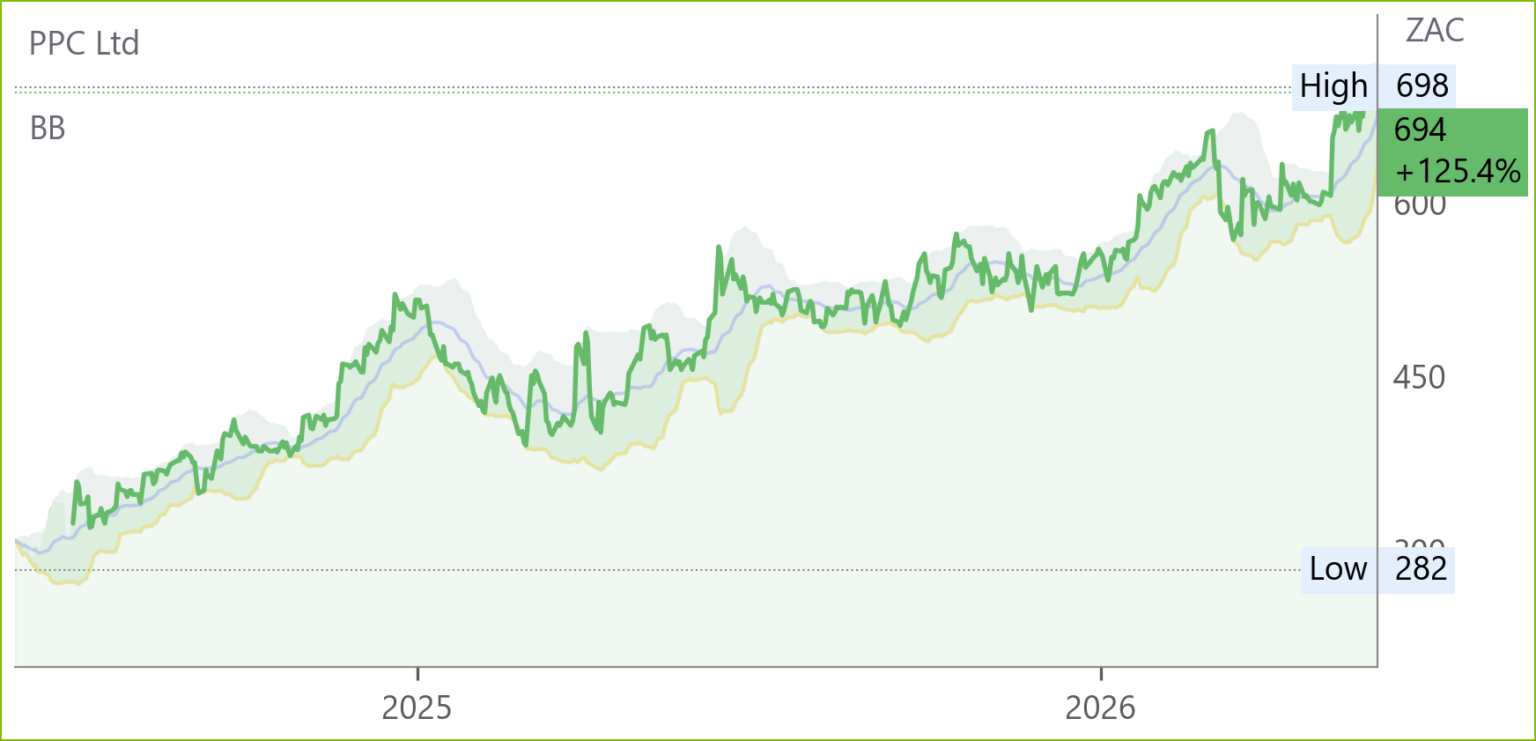
HEPS: 48c – 53c (↑20%–33% from 40c)
EPS: 52c – 58c (↑63%–81% from 32c)
Pro forma EPS: 60c – 66c (↑88%–106% from 32c)
Pro forma HEPS: 54c – 60c (↑35%–50% from 40c)
Earnings growth reflects operational efficiencies, value‑accretive sales, and sustained cost control under the Awaken the Giant turnaround strategy. Adjusted EPS and HEPS exclude foreign exchange losses incurred on hedging US$ exposure for the RK3 cement plant in the Western Cape, which was fully hedged to de‑risk the balance sheet. Management emphasised a fundamentally stronger earnings base, delivering robust results for a second consecutive year. Results due 8 Jun ’26.
Copper 360 (CPR) Trading Statement FY26 (55c)
HEPS: loss 18.49c–20.44c (↓45–40% vs -33.82c)
EPS: loss 18.97c–20.97c (↓58–54% vs -45.65c)
Losses narrowed significantly due to the absence of a R113m impairment booked in FY25, though a R33.8m loss was incurred on equity issuance during the rights issue. Weighted average shares rose to 1.29bn, with issued shares at 2.95bn. Management emphasised improved performance despite dilution. Results due 29 May ’26.
Snippets
Labat (LBT) will acquire 20% of Mozfinders Lda, a Mozambique‑based logistics and industrial solutions company, for R24m via 200m shares at 0.05c and R14m cash. Mozfinders reported R100m profit after tax, R213.5m revenue and NAV of R80m. The deal provides strategic exposure to Mozambique’s infrastructure, energy and cross‑border trade sectors, supporting Labat’s African expansion strategy.
Sappi (SAP) and UPM agreed to form a 50/50 joint venture combining European graphic paper businesses. Sappi contributes €320m assets (net €267m), UPM €1.1bn (net €740m). Funded via €600m bridge debt and €100m revolving credit, the JV targets €100m annual synergies. EU Commission Phase II review concludes 26 Oct ’26; shareholder circular due 30 Jun ’26.
Sirius (SRE) notarised the €49.8m acquisition of a fully let defence-supported business park in Fulda, Germany, comprising 57,771 sqm of lettable space with annual rent roll of €3.93m and EPRA net initial yield of 7.8%. Anchored by a leading ballistic protection manufacturer representing 78% of rent, the site is expected to transition to a near single-tenant asset with rental income of ~€4.0mCurrent page+1. CEO Andrew Coombs said the deal strengthens exposure to defence-sector demand and lifts recently acquired defence assets to just over €200m at a blended yield of 8.9%