Finova Investor Digest
Global Indices


Currency Crypto & Commodities


SA Indices


SA Upcoming Dividends & Economic Data


SA Equity
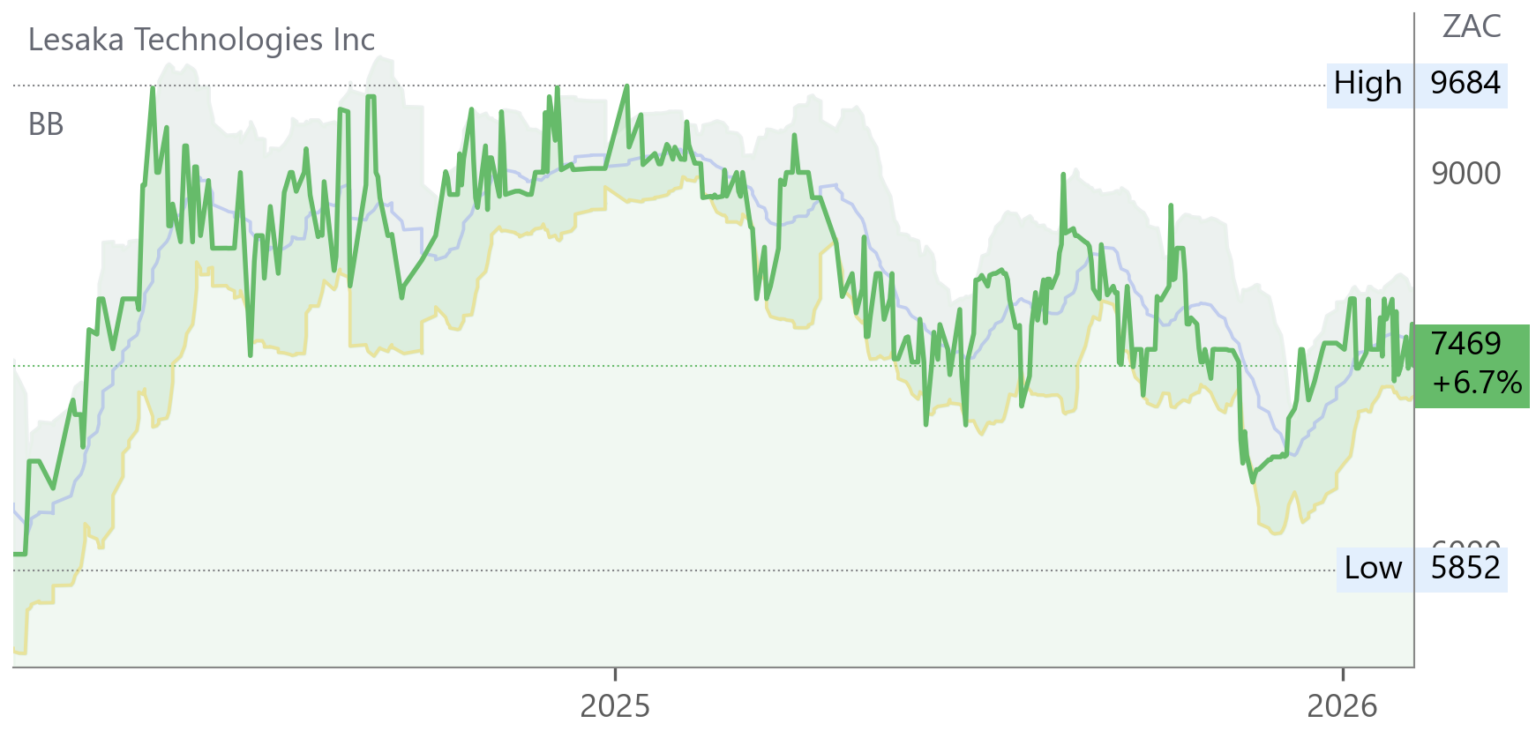
Lesaka (LSK) (Formerly Net1) Results for Q2 FY26 (7469c)
EPS: 0.04 US¢ (vs -0.40 US¢ Q2 FY25)
Operating Profit: US$2.15m (+265% vs US$0.55m Q2 FY25)
Revenue: US$178.7m (-3% vs US$176.2m Q2 FY25)
EBITDA: US$17.8m (+47% vs US$11.6m Q2 FY25)
Explanation: EPS swung positive after losses, driven by strong Consumer (+38% revenue, +106% EBITDA) and Enterprise (+58% revenue, +67% net revenue) growth. Merchant revenue fell 13%, weighing on topline.
Lesaka achieved its first positive net income since inception, supported by Consumer and Enterprise growth offsetting weaker Merchant revenue. Adjusted earnings rose 564% to US$6.5m, with EBITDA up 47%. Management reaffirmed FY26 guidance, targeting ZAR 6.4–6.9bn net revenue and ZAR 1.25–1.45bn EBITDA, excluding the pending Bank Zero acquisition. “I am delighted that for the first time since the creation of Lesaka in 2022, we have delivered a positive Net Income and met our guidance for the 14th consecutive quarter.” – Ali Mazanderani, Chairman.
Comment: with management forecasting adjusted Eps of “at least” 469c for FY06/26, the stock is on a 6 month FPE of 15.8x ahead of the inclusion of Bank Zero, co-founded by Michael Jordaan, whose management will be joining the team. With one of the new entities “disrupting” the banking sector and fintech services across the informal sector including spaza shops, this stock is definitely one to watch if not in which to take precautionary positions.

KAL Group (KAL) Financial Results for FY25 (4898c)

HEPS: 620.98c (↑10.6% from FY24)
Operating Profit: improved, supported by debt reduction
Gross Profit: ↑3.9% from FY24
FY25 marked a turnaround for KAL Group, with headline earnings up 9.5% and recurring HEPS rising 11.2% to 624.47c, reversing the mid-year decline. Gross profit increased 3.9%, while aggressive debt reduction of R436m lowered the debt-to-equity ratio to 38.1%, the lowest in 15 years. CEO Sean Walsh noted: “At mid-year, we spoke about the momentum building in our business and the uplift we expected in the second half – and we have delivered exactly that.” – Sean Walsh, CEO.
KAL Group confirmed progress on the disposal of Agriplas and related property, with all suspensive conditions fulfilled except Eswatini Competition Commission approval, extended to 16 Feb ’26. Parties waived the conveyancer condition and amended the effective date to 31 Jan ’26.
Comment: with the lower debt: equity level the stock is indeed “well placed to capture any uptick in business activity across business segments” which implies it is on a double digit FDY. For a re-rating, however, it would have to show it is back on a steady growth path after the FY24 setback. The stock is trading at around NAV after five years of Return on Net Assets at around 10%.

Operating Updates & Trading Statements
Anglo American (AGL) Q4 2025 Production Report & Trading Statement (74899c)

Anglo American delivered a resilient Q4 2025, with copper output steady at ~244kt, iron ore production up 1% to 36.1Mt, and platinum group metals broadly in line with guidance. Diamonds production was slightly lower due to grade variation, while metallurgical coal volumes improved on operational stability. Cost discipline and portfolio optimisation supported margins despite softer commodity prices. CEO Duncan Wanblad emphasised operational excellence and sustainability: “We delivered another strong performance, underpinned by operational excellence and our commitment to re‑imagining mining for a safer, cleaner future.” – Duncan Wanblad, CEO. Full-year results due later in Feb ‘26.
Kumba Iron Ore (KIO) Production & Trading Statement FY25 (37559c)

HEPS: 4322c–4781c (+11%–23% vs 3894c FY24)
EPS: 4283c–4739c (-7% to +3% vs 4581c FY24)
HEPS rose 11–23% on stronger realised iron ore prices (+12% vs benchmark), higher sales volumes (+2%) and penalty income from Transnet. EPS growth lagged due to prior-year impairment reversal at Kolomela.
Production rose 1% to 36.1 Mt, with Q4 output up 10% to 8.6 Mt. Sales increased 2% to 37.0 Mt despite logistical constraints, while finished stock held steady at 7.5 Mt. Kumba achieved an average realised FOB price of US$95/wmt, outperforming the benchmark by 12%. CEO Mpumi Zikalala highlighted operational resilience, UHDMS project progress and collaboration with Transnet as key enablers. Guidance for 2026 is lower production (31–33 Mt) due to UHDMS tie-in, with sales of 35–37 Mt. Results due 19 Feb ‘26.
Sasol (SOL) Trading Statement for 6M Dec 25 (11373c)

HEPS: 850c–1000c (-29% to -40% vs 1413c in 6M Dec 24)
EPS: 10c–80c (-89% to -99% vs 722c in 6M Dec 24)
EBITDA: R19bn–R23bn (-4% to -21% vs R24bn in 6M Dec 24)
EPS collapsed due to R7.8bn impairments, weaker oil and chemical prices, while HEPS fell 29–40%. EBITDA declined modestly, cushioned by >100% refining margin gains, higher sales volumes and cost discipline.
Sasol flagged sharp earnings decline for 6M Dec 25, with EPS down up to 99% and HEPS lower by up to 40%. Impairments of R7.8bn, weaker Brent crude and chemical prices weighed heavily, though improved refining margins, stronger volumes and cost control provided partial relief. Free cash flow is expected to improve on reduced capital expenditure. Significant impairments included the Secunda refinery (R3bn) and Mozambique PSA (R3.9bn). Results due 23 Feb ‘26.

Orion Minerals (ORN) Business Update (43c)

Exploration and development activity at Prieska Copper-Zinc and Okiep Copper projects continued, with Orion securing additional funding through equity raising to strengthen liquidity and support ongoing feasibility work. Strategic partnerships, including offtake and financing discussions with Glencore, remain central to project advancement. CEO Tony Lennox emphasised commitment to building South Africa’s next generation of copper producers: “We are positioning Orion as a key player in the global copper supply chain, creating long-term value for shareholders and communities.”
Orion also announced its selection for BHP’s 2026 Xplor accelerator programme, securing US$500,000 in equity-free funding to advance copper and zinc exploration in South Africa’s Northern Cape. The partnership provides Orion access to BHP’s global expertise and networks, strengthening its critical minerals portfolio and positioning it to support the global energy transition.
Comment: the fact that the funding is for exploration beyond Orion’s Prieska and Okiep projects, for which development plans are already in place, is an endorsement by the global major of the extensive potential for further discoveries in the Northern Cape.

Valterra Platinum (VAL) Production Report Q4 Dec 25 (142339c)

Valterra delivered its strongest quarter of 2025, with total PGM production up 1% to 880,200oz and refined output rising 6% quarter-on-quarter to 1,039,400oz. Own-mined volumes increased 10% QoQ to 594,600oz, driven by Amandelbult’s recovery and higher grades at Mogalakwena. PGM sales rose 4% to 1,042,100oz, supported by rollover volumes and minor PGMs. Safety improved with zero fatalities and a 26% lower TRIFR. Nickel output grew 12% to 7,098t, chrome rose 17% to 298,000t, while copper slipped 2% to 4,413t. The realised basket price surged 41% in ZAR terms to R38,723/oz, reflecting strong platinum (+78%) and rhodium (+70%) gains. Results due 25 Feb ‘26.
Impala Platinum (IMP) Trading Statement for 6M Dec ’25 (27525c)

HEPS: 1 015–1 054c (↑392–411% from 206c)
EPS: 1 015–1 054c (↑387–407% from 208c)
Operating Profit: Significantly higher, supported by stronger basket prices
Revenue: Boosted by US$ PGM basket appreciation
Gross Profit: Higher, aided by operational delivery
EBITDA: Strong increase in line with earnings
HEPS and EPS surged over 390% due to a sharp rise in achieved US$ PGM basket prices and commendable operational performance. Earnings rose to R9.10–R9.45bn, compared to R1.85–R1.87bn previously. Operational delivery was commendable, with efficiencies and stable production underpinning earnings growth. Significant appreciation in US$ PGM basket pricing provided strong tailwinds. No direct management quotes were included in the statement. Results due 5 Mar ’26.

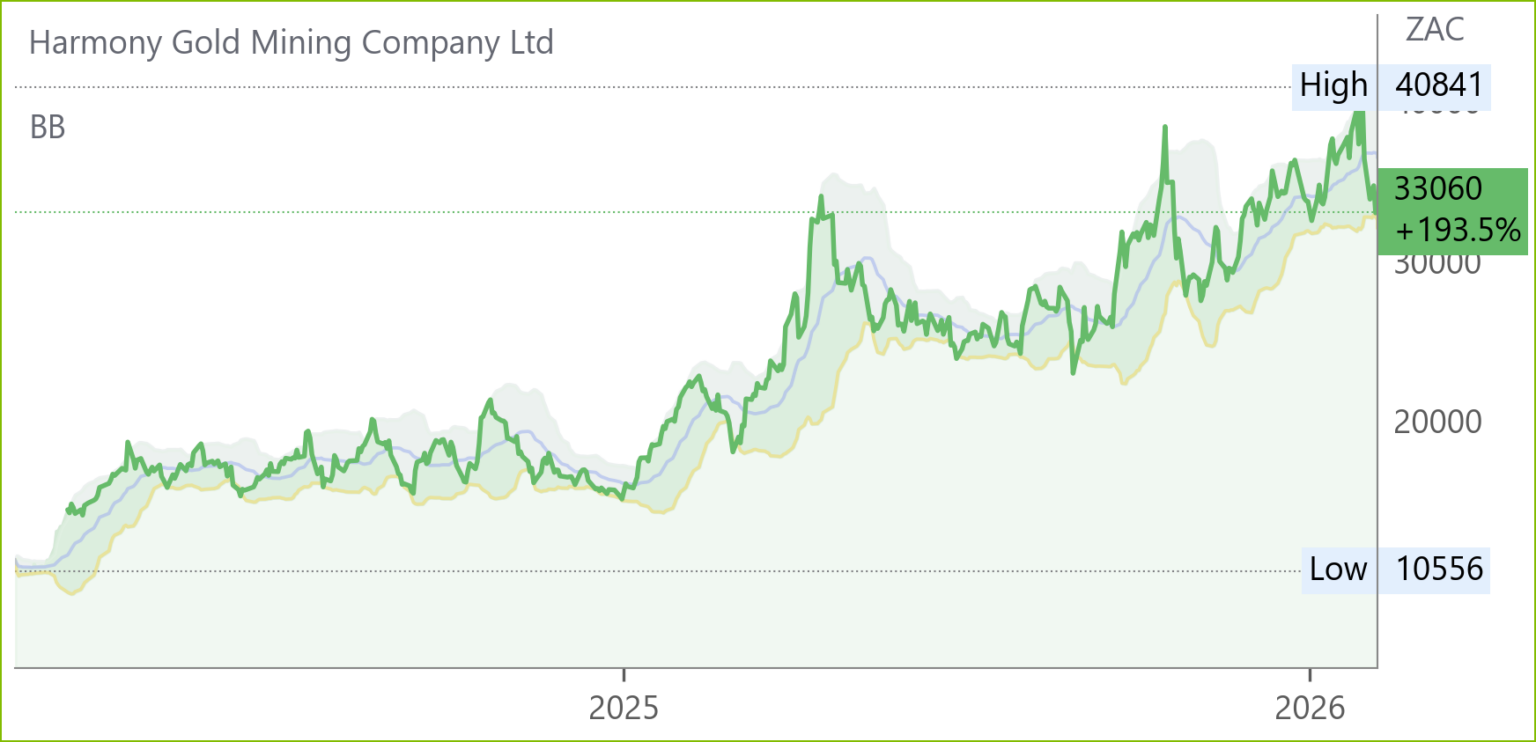
Harmony Gold (HAR) Guidance for 6M Dec ’25 (33060c)
HEPS: Guidance indicates increase vs prior period
EPS: Guidance indicates increase vs prior period
Operating Profit: Expected higher, supported by stronger gold prices
Revenue: Boosted by elevated commodity pricing
Gross Profit: Improved, aided by operational delivery
EBITDA: Higher in line with earnings guidance
HEPS and EPS are both expected to rise significantly, driven by elevated gold prices and commendable operational performance. Cash flows strengthened, positioning Harmony to deliver improved earnings.
Operational delivery was commendable, with stable production underpinning guidance. Elevated gold prices provided strong tailwinds, enhancing cash generation. Management reaffirmed confidence in meeting full-year guidance, citing operational resilience and disciplined cost control. Results due Mar ’26.
Comment: according to JSE usage “significant “means up to 15% although some investors might have hoped for “substantial”, i.e. up to 25%. At the Mining Indaba, on 9th and 11th of February ahead of results in March, management will be participating in a “fireside chat” and a panel discussion. Overseas investors will be particularly interested in the progress of the Wafi-Golpu copper project in Papua New Guinea as well as those in the supportive and pro-mining jurisdiction of Australia.

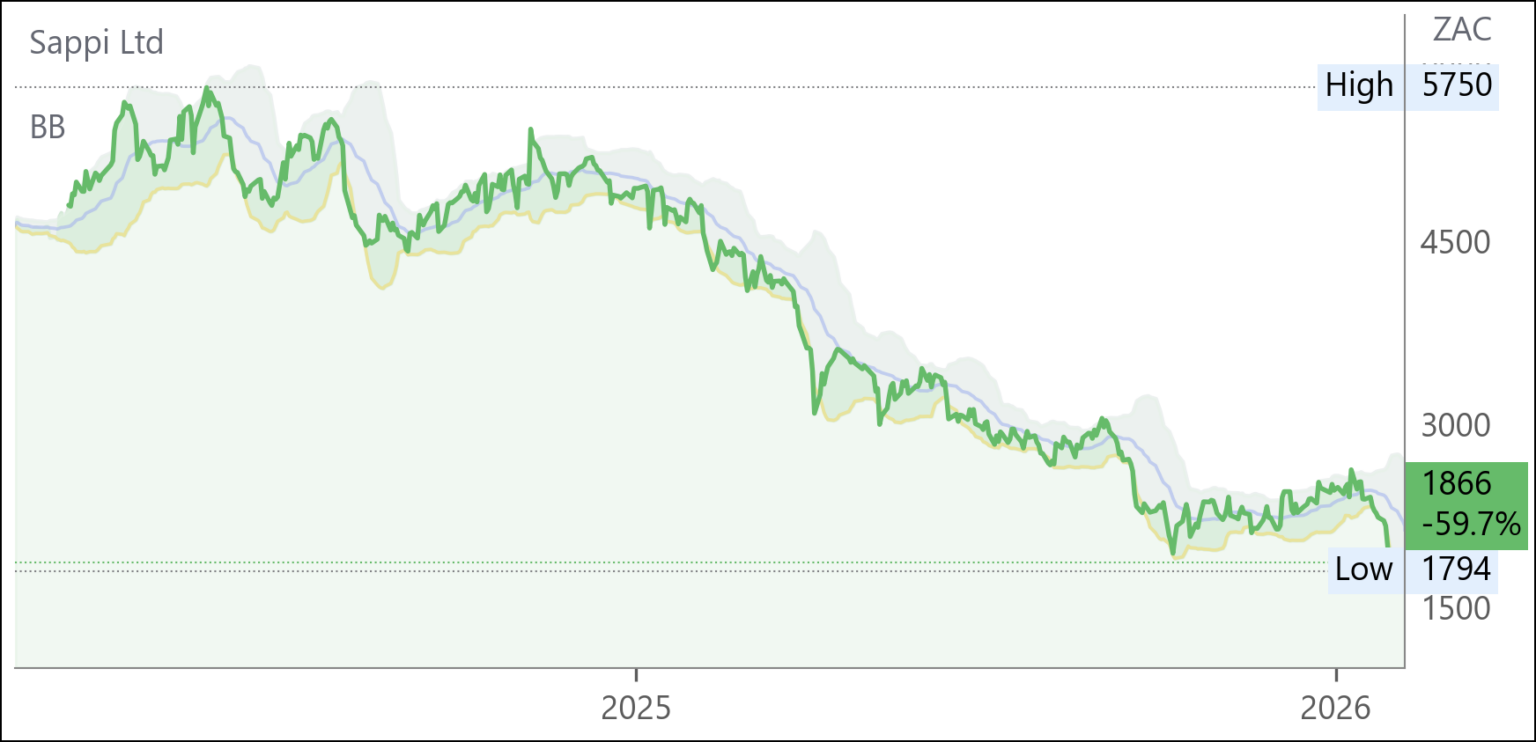
Sappi (SAP) Results for Q1 Dec 25 (1866c)
HEPS: -3 US¢ (vs 12 US¢ in Q1 Dec 24)
EPS: -3 US¢ (vs 14 US¢ in Q1 Dec 24)
Operating Profit: US$30m (-77% vs US$132m in Q1 Dec 24)
Revenue: US$1,287m (-6% vs US$1,363m in Q1 Dec 24)
EBITDA: US$90m (-56% vs US$203m in Q1 Dec 24)
EBITDA fell 56% and operating profit dropped 77% due to weaker dissolving wood pulp prices, Rand appreciation, and maintenance disruptions.
Revenue declined 6% to US$1.29bn, with EBITDA halving to US$90m and a net loss of US$37m. Market conditions remained challenging, marked by subdued consumer confidence, overcapacity, and pricing pressure across all segments. Rand strength against the US Dollar and lower dissolving wood pulp prices further weighed on results. CEO Steve Binnie noted: “Market conditions remained challenging during the quarter with ongoing macroeconomic pressures, subdued consumer confidence and overcapacity driving pricing declines across all product segments.” Outlook remains cautious, with focus on cost discipline and operational efficiency.
Comment: not quite everything has gone wrong that can go wrong but both secular and cyclical factors have combined to push the stock to the lowest level in ten years if not many more. Back in 2025, after capex of $500m investors might have looked to benefit from the expected decline and indeed it is expected to be around $300m for both FY26 and FY27. The stock will of course recover and further actions such as the merging of Sappi’s European graphic paper operations with the paper business of Finland’s UPM-Kymmene might even be taken to mitigate the industry malaise. But the bottom line for investors is that the dawn of a cyclical or even secular growth era is far enough away not to anticipate it, but to wait for it.

Shoprite (SHP) Interim Results for 6M Dec ’25 (26403c)

Revenue: R136.8bn (↑7.2% from R127.6bn in Dec ’24)
Merchandise sales grew 7.2% to R136.8bn for the six months ended Dec ’25, supported by strong RSA supermarket performance, LiquorShop resilience, and continued expansion of Checkers Sixty60. Inflationary pressures and load-shedding costs weighed on margins, but disciplined cost control and new store openings underpinned growth. CEO Pieter Engelbrecht commented: “We remain focused on delivering value to customers while investing in innovation and efficiency to sustain long-term growth.” – Pieter Engelbrecht, CEO. Results due 3 Mar ’26.
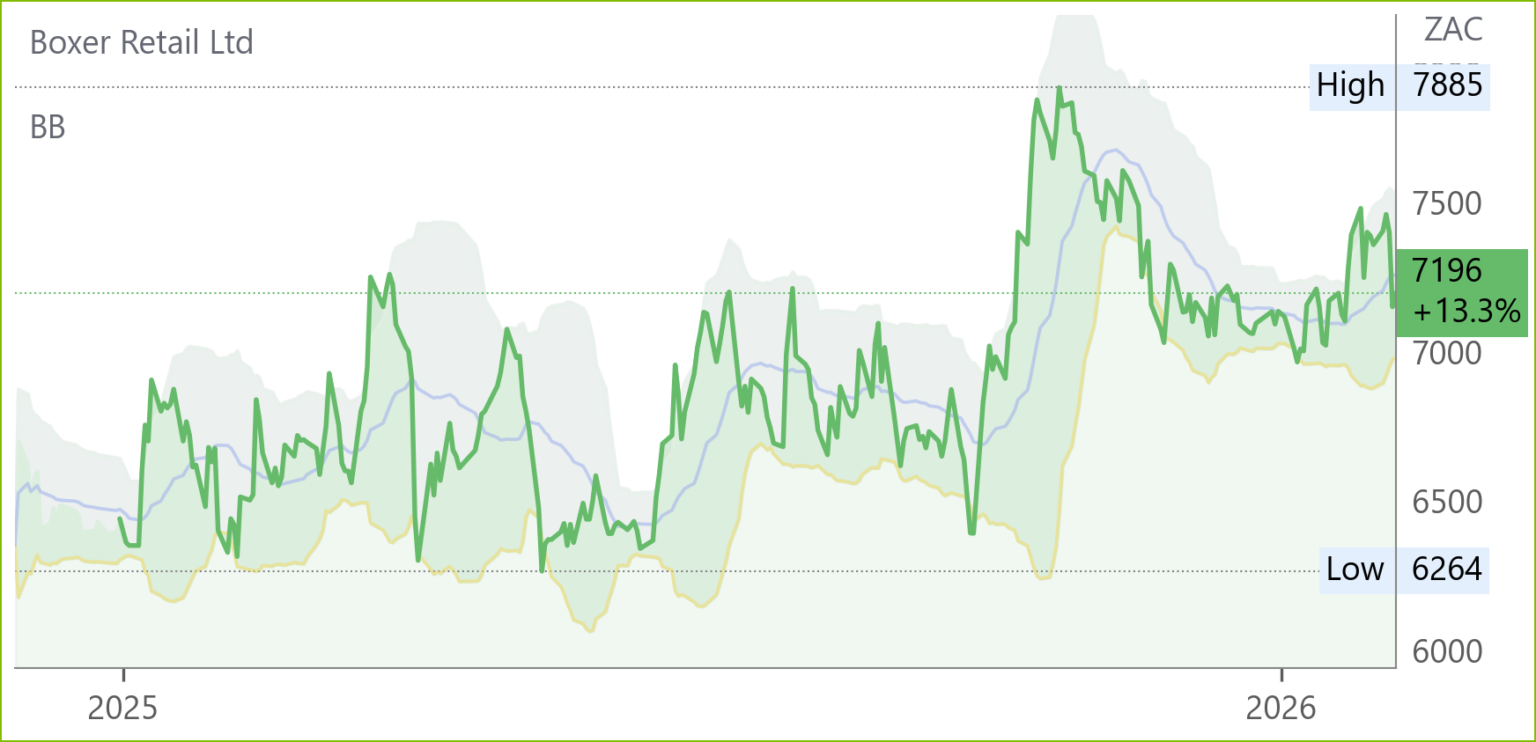
Boxer (BOX) Trading Update for 48W to 1 Feb 26 (7196c)
Revenue/Turnover: +11.9% (like-for-like +3.9%)
Turnover rose 11.9% for the 48 weeks to 1 Feb 26, with like-for-like growth of 3.9%. Momentum softened in the latter part, with 22-week turnover up 9.8% and like-for-like 2.4%. Strong September–October growth was offset by a weak November due to a constrained Black Friday period and a high prior base, before steady recovery in Dec–Jan. Market share gains were consistent, while internal selling price inflation was -1.0%. Boxer remains on track with FY26 store rollout and expects full-year sales growth ahead of the reported period, supported by a softer Feb 25 base. Management anticipates meeting FY26 trading profit growth objectives.
Pepkor (PPH) Trading Update for Q1 FY26 (2617c)
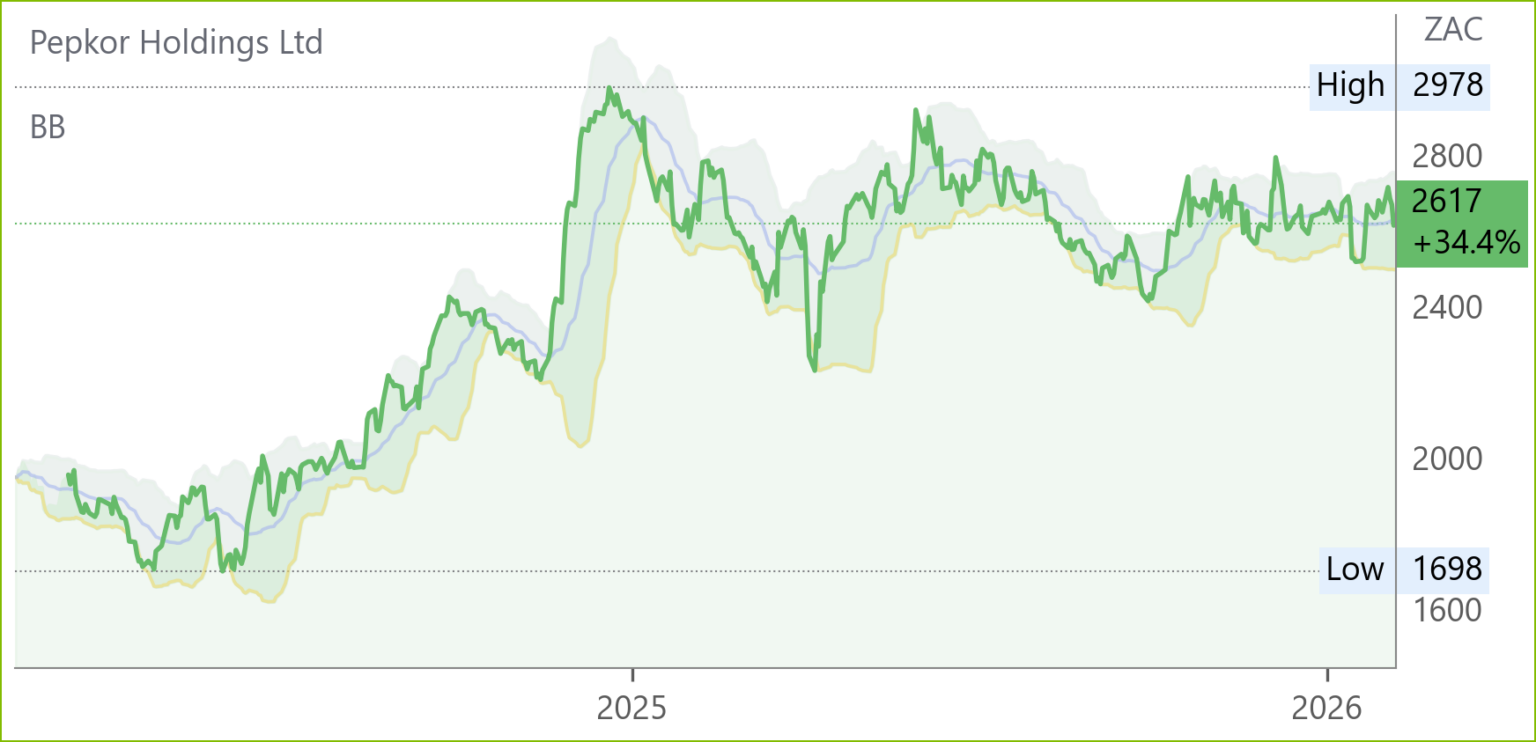
Revenue: R29.9bn (↑12.9% from R26.5bn in Q1 FY25; ↑8.3% excl. acquisitions)
Revenue grew 12.9% to R29.9bn in Q1 FY26, supported by targeted acquisitions and resilient consumer demand. Excluding acquisitions, revenue rose 8.3%, with clothing & general merchandise up 10.3% and furniture/appliances/electronics up 13.7%. Pepkor highlighted strong two-year CAGR of 10.3%, reflecting sustained momentum despite a challenging retail environment. Management noted ongoing benefits from scale and diversification, positioning the group to capture value across segments. CEO Pieter Erasmus commented: “Pepkor continues to deliver resilient growth by focusing on affordability and accessibility for our customers.” – Pieter Erasmus, CEO.
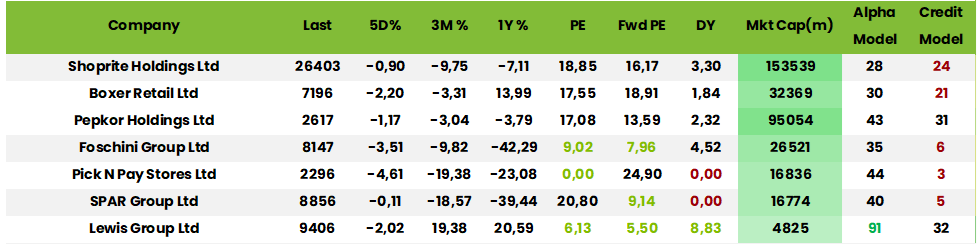
Comment: the market is likely to have to await the interims for further news of Pepkor’s plans to be one of the banking industry “disruptors” along with Tyme Bank. Lesaka, Old Mutual Bank and Discovery. Its 5000 store outlets exceeds the combined branch total of Absa, FNB, Capitec. Nedbank and Standard Bank and it has 32 million known customers on its books. It already processes 2 million money transfers per month, 4 million bill payments, 22-million cash withdrawals and another 22-million cash deposits, plus 65000 personal loans per month. Although the c.16.4x PE is one of the highest in the sector it is likely only partially discounting the possible success of this venture.
The Foschini Group (TFG) Trading Statement Q3 FY26 (8147c)

HEPS: Guidance unchanged, impairments have no impact
EPS: At or below 784.5c (↓≥20% from 980.6c)
Operating Profit: Impacted by clearance activity and weaker festive trading
Revenue: Group sales ↑7.5% YTD, ↑2.9% Q3; online ↑36.6% YTD, ↑23.4% Q3
Gross Profit: ↑6.3% YTD, margin ↓80–90bps
EPS decline is driven by non-cash impairments of up to R750m in UK and Australian brands, while HEPS remains unaffected. Group sales grew, supported by strong online momentum and Bash platform scale benefits.
SA trading remained subdued, with Black Friday strength offset by weaker December. Market share rose 60bps in homeware and furniture, apparel maintained. UK and Australia faced macroeconomic headwinds, prompting brand impairments. Management emphasised disciplined cost control, prudent capital allocation, and inventory clearance. “Taken together, these factors point to a gradual recovery in trading performance as local macroeconomic conditions improve.” – TFG outlook statement. Results due 5 Jun ’26.
Snippets
Glencore (GLN) announced it has signed a non‑binding MoU with the US‑backed Orion Critical Mineral Consortium (Orion CMC) for the potential acquisition of a 40% stake in its Democratic Republic of Congo assets, Mutanda Mining (Mumi) and Kamoto Copper Company (KCC). The deal implies a combined enterprise value of about US$9 billion. Glencore additionally confirmed Rio Tinto will not pursue a takeover after failing to agree on merger terms. Glencore emphasized its strong standalone case, highlighting diversified commodities, leading marketing, and copper growth ambitions. The company reaffirmed confidence in long-term value creation, positioning itself as a major future copper producer despite the collapsed talks.
MTN (MTN) confirmed it is in advanced talks to acquire the remaining shares of IHS Holding Limited it does not own, aiming for full control of the tower operator. The potential offer would be near IHS’s recent NYSE trading levels. No binding agreement has been reached, and completion of the transaction remains uncertain.
Vukile’s (VKE) subsidiary Castellana will acquire Berceo Shopping Centre in Logroño, Spain, via a EUR108m share purchase agreement with Barings Core Spain Socimi. Berceo, a 49,416m² regional mall anchored by Primark, Zara, Media Markt and Carrefour, achieved EUR101m sales and 6.3m visitors in 2025. The deal, effective 30 Jan 2026, offers a 7% NOI yield and 8.6% cash-on-cash return, funded by cash and EUR50m debt (46% LTV). Forecast FY27 net profit: EUR4.8m.
Sappi (SAP) and UPM-Kymmene signed a non-binding Letter of Intent to form a 50/50 joint venture combining their European graphic paper businesses. The Category 1 transaction under JSE rules requires shareholder approval via ordinary resolution. A circular with full details will be distributed by 30 April 2026, followed by a general meeting to vote.
Discovery (DSY) will acquire Phase 1 of its Sandton head office, 1 Discovery Place, from Growthpoint for R4.05 billion, funded by debt, while cancelling the Phase 2 lease. The deal, subject to regulatory approval, secures ownership, optimises space, and delivers about R800 million in net present value savings, improving earnings and reducing leverage over time.
Datatec (DTC) announced that its subsidiary Logicalis USA has acquired Maple Woods Enterprises to strengthen its managed security services. The deal enhances Datatec’s cybersecurity capabilities and expands its footprint in the U.S. market, aligning with its strategy to grow ICT solutions globally.
Zeder (ZED) announced its firm intention to dispose of all shares and shareholder loan claims in Zaad Holdings for a purchase consideration of R1.9 billion. The transaction requires shareholder approval. The disposal reflects Zeder’s portfolio optimisation strategy, unlocking value and reallocating capital away from agricultural inputs and seed operations.
Mpact (MPT) announced it has begun a Section 189A process under the Labour Relations Act, signalling the contemplated discontinuation of operations at its Springs Paper Mill. The board approved this step on 2 Feb ’26, citing operational and financial challenges. The process may lead to restructuring and potential job losses, subject to consultation.