
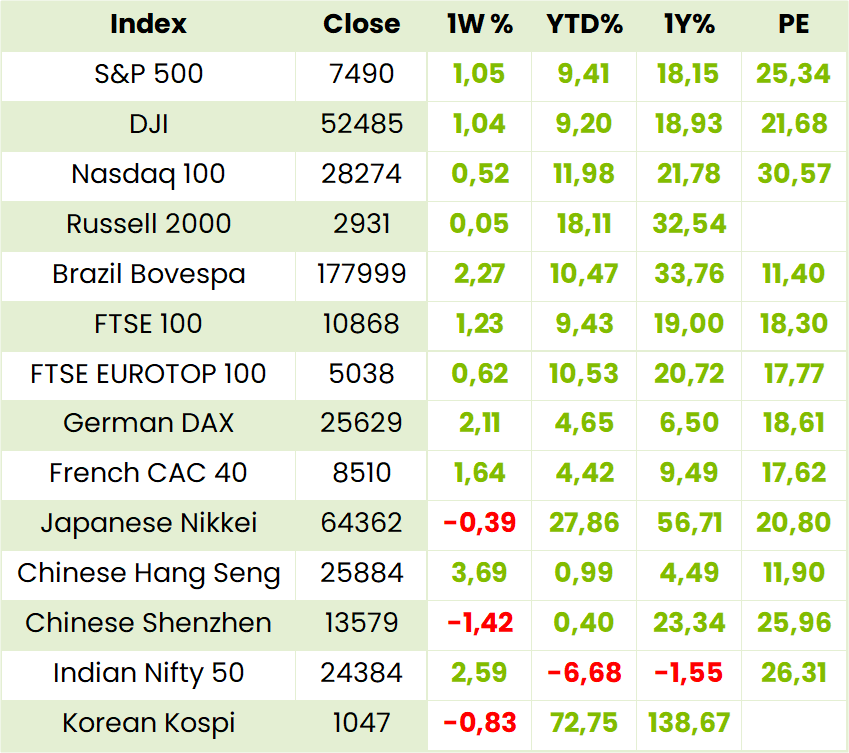
Global Indices

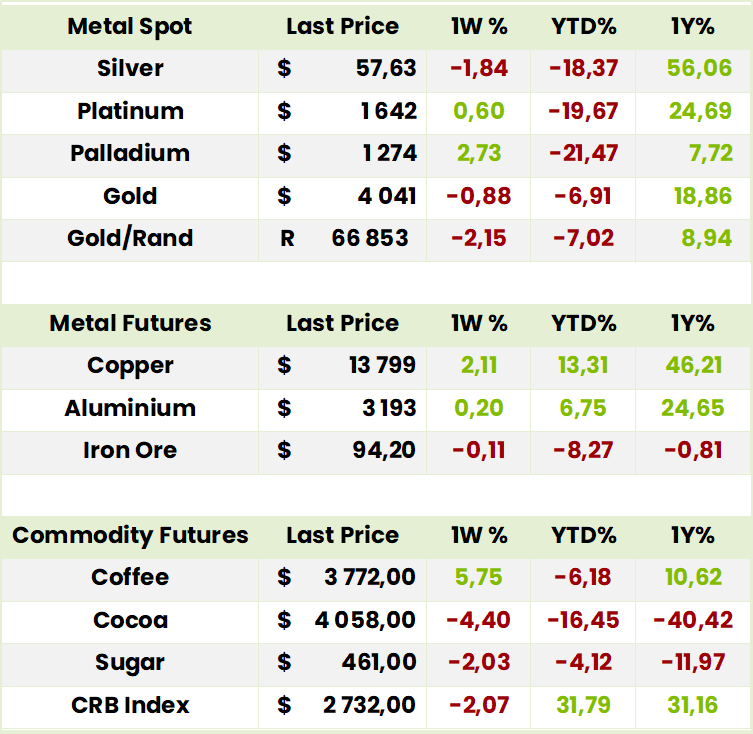
Currencies, Crypto & Commodities

SA Indices
SA Upcoming Indicators & Dividends


Global Equity
Samsung (5930.KS) reported record April–June profit, up 19x year-on-year, with revenue at an all-time high and growth driven almost entirely by semiconductors. Management expects memory demand to stay strong and supply tightness to widen. Long-term AI infrastructure contracts with five major data-centre clients and a second Texas factory underline confidence in sustained demand.
Microsoft (MSFT) reignited confidence in the AI trade as Azure revenue rose 43%, its fastest cloud growth in almost four years. Management guided for roughly 45% growth next quarter, with demand still exceeding supply. Revenue climbed 20% to $90bn and profit beat expectations, while Copilot paid users rose to 30m from 20m.
Meta (FB) disappointed with its quarterly revenue outlook, reinforcing investor concerns that AI returns are lagging heavy investment. Free cash flow fell to multi-year lows as spending on data centres, smart glasses and other AI bets ballooned, potentially reaching $145bn this year. Zuckerberg defended the outlay, citing strong external interest in Meta’s computing capacity.

*holding in a Finova portfolio
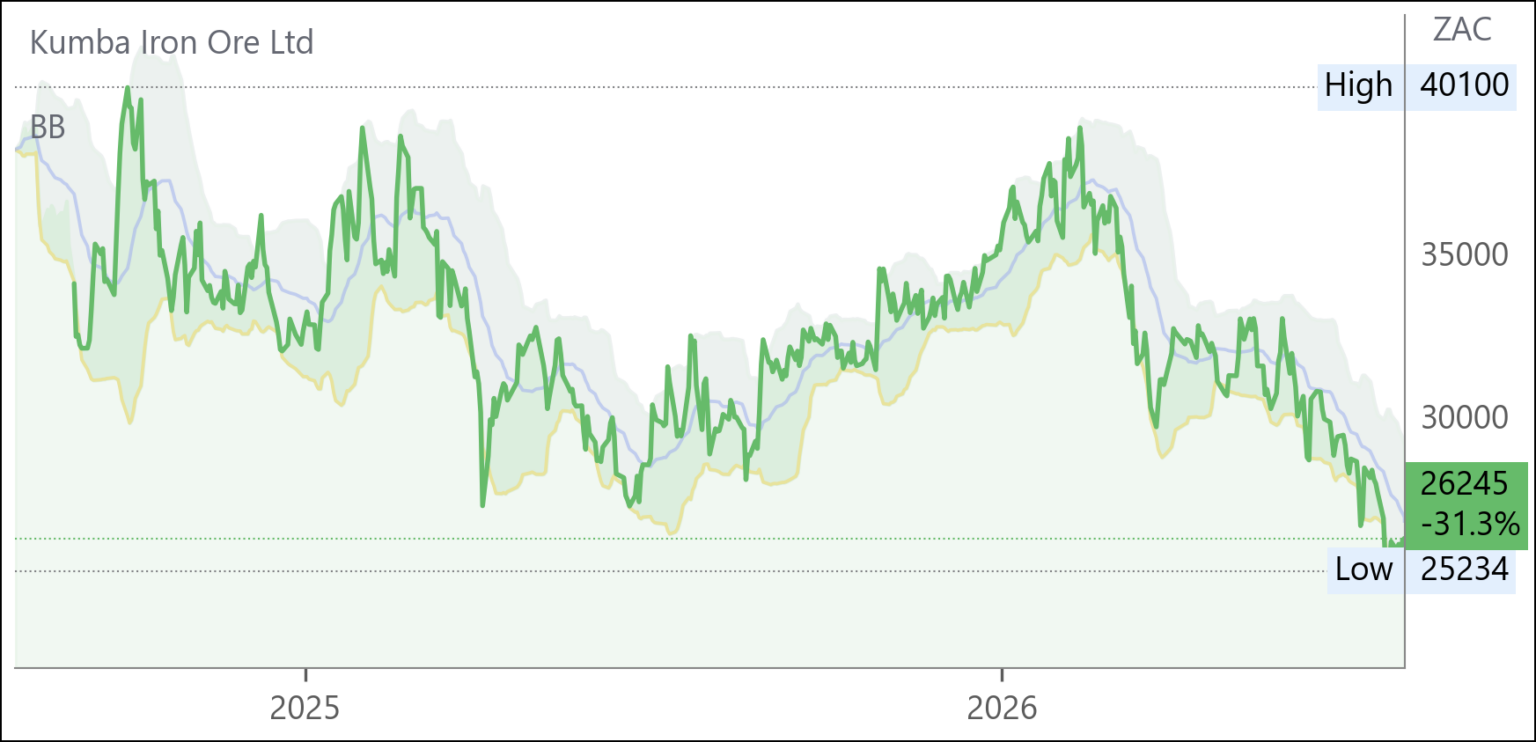
Kumba* (KIO) Interim Results for 6M Jun ’26 (26179c)
HEPS: 1324c (↓41% from 2226c)
EPS: 1295c (↓42% from 2217c)
Revenue: R30.9bn (↓11% from R34.5bn)
EBITDA: R10.9bn (↓35% margin maintained)
Dividend: 790c interim (↓52% from 1660c)
Production slipped 3% to 17.7Mt, with Kolomela down 16% while Sishen rose 3%. Sales volumes eased 1% to 18.6Mt. Average realised export price of US$90/wmt was 8% above benchmark, but weaker demand and higher costs compressed earnings. Net cash closed at R12.1bn, with free cash flow of R1.9bn and ROCE at 26%. CEO Mpumi Zikalala noted: “Despite challenging external conditions, we delivered EBITDA of R10.9bn and remain focused on cost optimisation, capital discipline and sustainable shareholder returns.”
An interim dividend of R7.90/share was declared, payable 24 Aug ’26, with empowerment partners receiving R0.8bn.
Comment: it is not as though everything that could go wrong in 1H26 did so but , nevertheless, there are a number of positive factors to consider: a repeat of 1H excessive rain is unlikely; the users group and Transnet are making steady progress and normal tonnages are likely again by FY29 if not earlier; numerous productivity gains and other benefits from the HDMS project include lengthening the Sishen life of mine by 6 years and while Chinese efforts to boost the economy may not be spectacular, demand for Kumba’s quality ore will continue. Kumba is not going to shoot the lights out but is underpriced and a healthy double digit dividend yield will compensate holders anticpating more accurate pricing of the share.

Valterra Platinum (VAL) Interim Results for 6M Jun ’26 (123133c)

HEPS: 8202c (↑1,634% from 473c)
EPS: 8231c (↑3,591% from 223c)
Operating Profit: R21.6bn (↑3,500% from R0.6bn)
Revenue: R81.8bn (↑93% from R42.3bn)
EBITDA: R33.4bn (↑406% from R6.6bn)
Dividend: 5700c interim (↑2,750% from 200c)
PGM production rose 4% to 1.52Moz, refined output surged 25% to 1.74Moz, and sales volumes climbed 18% to 1.74Moz. Realised basket prices increased 85% in US$ terms and 66% in rand, driving EBITDA up four-fold to R33.4bn and headline earnings to R21.5bn. Free cash flow of R25.5bn strengthened the balance sheet to a net cash position of R23.7bn. Operational highlights included improved chrome yields at Amandelbult (+18%) and concentrator recoveries at Mogalakwena (+15%). CEO Craig Miller stated: “Our exceptional first-half performance reflects strong operational momentum, disciplined execution and industry-leading shareholder returns.” An interim dividend of R57/share (70% payout ratio) was declared. Safety remained a concern with three fatalities, prompting enhanced risk management and leadership accountability. Guidance for FY26 production of 3.0–3.4Moz and unit costs of R19,000–R20,000/oz remains intact.
Comment: having fallen 43% since the closure of Hormuz at the end of February the share price recovered 5% following the, somewhat predictable, but nevertheless spectacular, results. The above mentioned operational improvements are indeed meaningful while renewable energy and other measures will help counter inflationary impacts resulting from the Middle East War. Underlying the share price collapse in March, was the concern that the move to EVs and net zero objectives, which were abating somewhat in the West, would resume given the increased risks and cost of oil. These concerns are well grounded but, on a FPE of 9.6X and FDY of 6.5% they are well discounted especially given the favourable production outlook.

Anglo American PLC (AGL) Interim Results for 6M Jun ‘26 (83109c)

HEPS: 0.14 USD (↓39% from 0.23 USD)
EPS: –0.80 USD (↓49% from –1.58 USD)
Revenue: USD 9 926m (↑11% from USD 8 954m)
EBITDA: USD 4 002m (↑35% from USD 2 955m)
Dividend: Interim dividend of USD 0.23 per share (↑229% from USD 0.07)
Revenue rose 11% to USD 9.9bn, with EBITDA up 35% to USD 4bn, driven by copper margins of 60% and strong operational discipline. Net debt reduced to USD 8.2bn, maintaining a 1.0x net debt/EBITDA ratio. Strategic portfolio optimisation advanced with the agreed sale of Steelmaking Coal for up to USD 3.875bn, ongoing De Beers restructuring, and Nickel divestment under EU review. CEO Duncan Wanblad stated: “We are unlocking the full potential of Anglo American – anchored in copper, premium iron ore and crop nutrients – while preparing to complete our merger with Teck to create a global metals and minerals champion.”
Comment: CEO Wanblad and his CFO fielded an unusually intense barrage of big picture and detailed questions at the interims presentations which nevertheless confirmed the positive outlook for what is to be a mining giant with 70% of its income from copper the outlook for which remains very positive with the metal price continuing to hold up well. There remain mountains of regulatory approvals including from major customer China and Korea as well as the TSX, NYSE, LSE and JSE which should be finalised in 1H 27. The likely rating by these markets, especially the mining oriented Candian bourse, will make investment now well worthwhile.

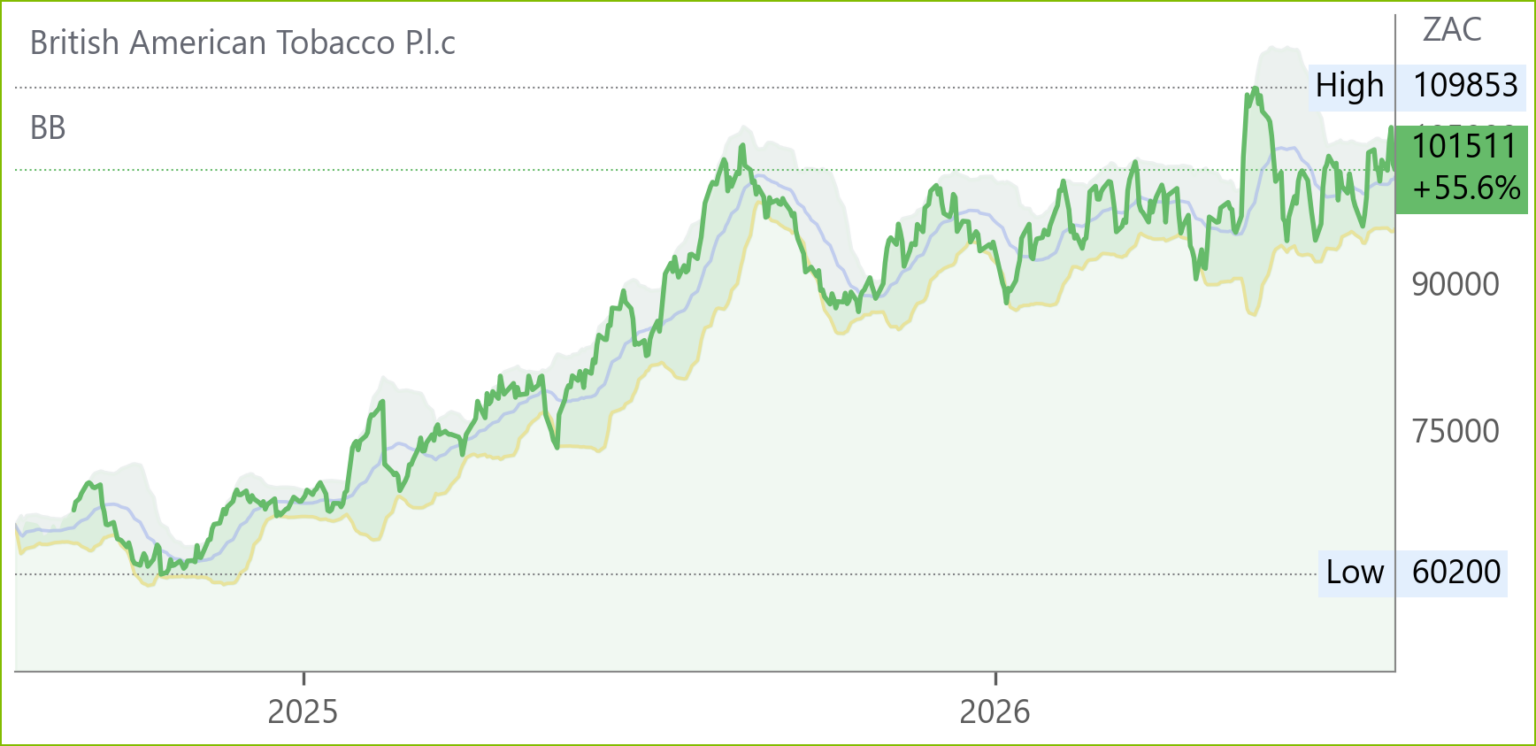
British American Tobacco (BTI) Interim Results for 6M Jun ‘26 (102089c)
HEPS: 167.7p (↑5.9% from 158.3p)
EPS: 145.3p (↓28.6% from 203.6p)
Operating Profit: £4 266m (↓15.8% from £5 067m)
Revenue: £12 235m (↑1.4% from £12 065m; ↑2.9% constant FX)
Gross Profit: Adjusted ↑1.8% (↑3.2% constant FX)
EBITDA: Adjusted profit from operations £5 426m (↑2.5%)
Dividend: Quarterly dividend of 61.26p per share (part of 245.04p annual interim declared Feb ‘26)
Revenue grew 1.4% with smokeless products now 19.8% of group revenue. New Categories revenue surged 18% to £1.93bn, led by Modern Oral (+65.9%) and U.S. Vapour recovery. Combustibles revenue rose 2.1%, driven by price/mix in the U.S. Adjusted EPS increased 7.9% despite reported EPS falling 28.6% due to prior year Canadian settlement credits. Free cash flow pre-dividend rose 85% to £2.3bn, with leverage expected within 2.0–2.5x by year-end. CEO Tadeu Marroco stated: “We are building momentum as we transform and I am confident we are firmly on track to deliver our full-year 2026 guidance.” Comment: in case some investors have a twinge of conscience when investing in the share, British American Tobacco (BAT) has set a clear strategic goal: This is part of its A Better Tomorrow™ vision to migrate adult smokers from cigarettes to scientifically substantiated smokeless alternatives. Moreover, just over 2 years ago when the share was trading at R600ps after 10 years of no growth, investors began to believe in the new strategy which has since achieved an EPS CAGR of 10.4%. While we believe a 5% CAGR is now more likely, there is a case for inclusion in long term portfolios at a starting yield of 5%.
AB InBev (ANH) Interim Results for 6M Jun ‘26 (140257c)

HEPS: 3.21 USD (↑65% from 1.95 USD)
EPS: 2.18 USD (↑22% from 1.79 USD)
Operating Profit: 4 314m USD (↑21% from 3 556m USD)
Revenue: 31 927m USD (↑11.5% from 28 642m USD)
Gross Profit: Not disclosed separately
EBITDA: 11 375m USD (↑5.6% from 10 776m USD)
Net Debt/EBITDA: 2.86x (↓12.5% from 3.27x)
Revenue rose 11.5% in HY26, supported by strong growth in Corona (+17% ex‑Mexico), no‑alcohol beer (+27%), and Beyond Beer (+44%). BEES Marketplace GMV surged 50% to USD 1.2bn. Underlying EPS climbed 22.1% to USD 2.18, aided by margin expansion in Q2. Volumes grew modestly (+0.8%), with beer volumes up 1.2%. Management expects EBITDA growth of 4–8% for FY26, capex of USD 3.5–4m, and a normalised tax rate of 26–28%. CEO Michel Doukeris highlighted “resilient megabrand performance and disciplined capital allocation” as key drivers. Comment: slow beer volume growth (1.2% in 1H26) has continued to test ABInBev’s move to no-alcohol beer, Beyond Beer and other products and the results are encouraging with 1H EPS growth of 22% well ahead of the 4 year EPS CAGR of 6.7%. This is another case of an iconic behemoth picking up pace thanks to new products with the share price breaking out of its post covid trading range and beginning to approach pre-covid levels. The share price has already re-rated strongly but can certainly be held or added to in long term portfolios.

Mondi (MNP) Interim Results for 6M Jun ‘26 (19450c)

HEPS: 5.4 euro cps (↓85% from 37.2 euro cps)
EPS: –57.8 euro cps (↓250% from 38.6 euro cps)
Operating Profit: €80m (↓71% from €272m)
Revenue: €3 975m (↑2% from €3 909m)
EBITDA: €379m (↓33% from €564m)
Dividend: Interim dividend of 9.42 euro cps (↓60% from 23.33 euro cps)
Revenue edged up 2% but profitability fell sharply due to higher input costs, lower selling prices, and a €35m forestry fair value loss. EPS swung to a loss of –57.8 euro cps, while HEPS dropped 85%. Six plants were closed or in process of closure as part of network optimisation. Cash generation remained solid at €347m, aided by working capital discipline. CEO Andrew King emphasised “strong pricing actions, cost discipline and operational excellence” and noted improved trading momentum with higher packaging paper prices and robust order books.
Comment: while the share price has taken a drubbing over the past two years (from R370 at the end of June 2024 to a recent low of R154) and management rightly points to resilience and some healthy order books, there are a large number of challenges and complexities across its operations most of which would be markedly ameliorated by a pickup in EU growth and an end to the disruptions from the Middle East. Should these occur, Mondi would indeed be well placed to benefit without significant capex as it has meaningful spare capacity right now. Meanwhile, it could be held for recovery but there is no rush to buy.

Canal+ (CNP) Half Year Results for 6M Jun ’26 (5666c)

Operating Profit (Adjusted EBIT): €433m (+68% from €257m)
Revenue: €4,287m (+40% from €3,072m)
Revenue surged 40% to €4.3bn, boosted by the consolidation of MultiChoice, while Adjusted EBIT rose 68% to €433m, reflecting synergies and seasonality. Cash flow generation improved, with free cash flow at €414m. MultiChoice turnaround gained traction, securing long-term Premier Soccer League rights and Rugby World Cup rights, alongside record subscriber acquisition in South Africa. STUDIOCANAL delivered strong theatrical successes and secured major film rights, including The Midnight Library. CEO Maxime Saada stated: “Our strong first-half results reflect our strategic progress… we have achieved half of our €250m synergies target and remain well on track for the year.” Full-year guidance confirmed: EBIT €735m, FCF above €250m.
Comment: CanalPlus has swallowed a python which will take a while to digest before the undoubted long term benefits manifest. On a Debt: Equity ratio of 85% and 1H heps of Eur 0.15 we would avoid for now.

Shaftesbury Capital (SHC) Interim Results for 6M Jun ’26 (3235c)
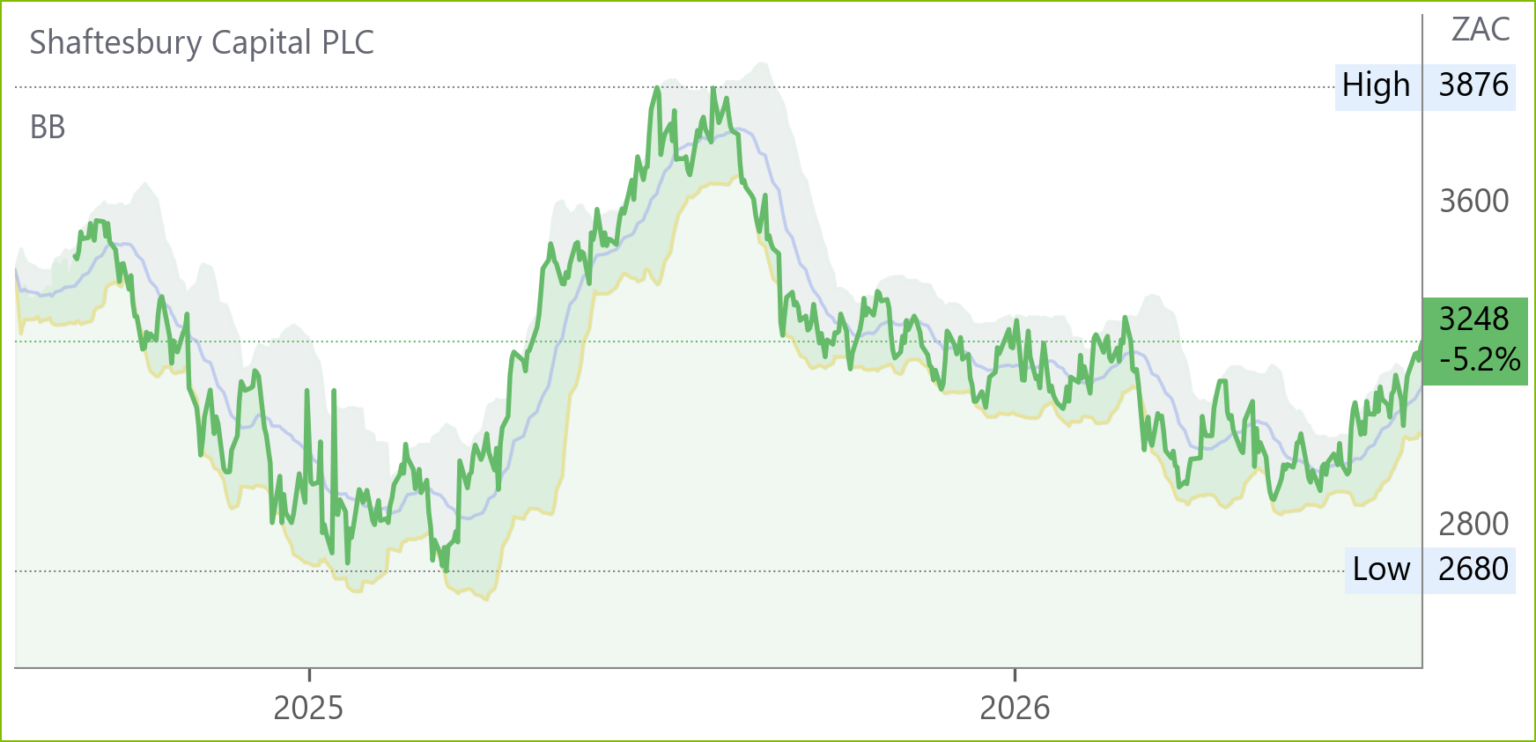
HEPS: 2.3p (+44% from 1.6p)
EPS: 10.6p (+28% from 8.3p)
Operating Profit: £193.8m (+28% from £151.6m)
Dividend: 2.2p interim (↑16% from 1.9p)
EPRA NTA: 223p/share (+3.9% from 214.7p)
LTV: 16.1% (↓ from 16.8%)
NAV: £4.11bn (+4% from £3.95bn)
Portfolio valuation rose 3.4% to £5.6bn, supported by ERV growth of 3.8% and 226 leasing transactions, 18% ahead of passing rents. High occupancy was maintained, with only 2.6% ERV available to let. Capital activity included £31.2m expenditure and disposal of a non-core asset for £64.7m. Net debt reduced to £787m, with EPRA LTV at 16.1%. A new £300m revolving credit facility was secured, enhancing liquidity. CEO Ian Hawksworth stated: “We have delivered strong performance… our prime West End portfolio continues to deliver high footfall, customer sales growth, high occupancy and a strong pipeline.” Interim dividend of 2.2p/share declared, payable 23 Sep ’26.
Comment: the share price has gone nowhere over the past 12 years but, right now, the portfolio looks as though it could get traction. Prior to the pandemic the prime retail and leisure portfolio performance, which had been pedestrian took a big hit in the Covid pandemic. Then there was a merger in 2023 following which the portfolio was eventually moved into a more concentrated, high quality, income stable asset base much of it in London’s West End that could support future growth if market conditions improve which would now appear to be the case.

ArcelorMittal South Africa (ACL) Interim Results for 6M Jun ‘26 (127c)

HEPS: –112c (↓33% from –84c)
EPS: –112c (↓33% from –84c)
Operating Profit: –R720m (↓35% from –R533m)
Revenue: R12 038m (↓30% from R17 118m)
EBITDA: –R409m (↓272% from –R110m)
Revenue fell 30% to R12bn, impacted by a 35% drop in crude steel production and elevated imports (47% of apparent consumption). EBITDA loss widened to R409m, including R571m in non‑recurring charges. Headline loss rose 47% to R1.49bn, while net borrowings increased to R7.9bn. Liquidity was preserved through cost reductions, procurement savings, and placing the Long Steel operation into care and maintenance. Management is progressing footprint optimisation, AI‑enabled productivity, and negotiations with Eskom and Transnet to reduce structural costs. Free cash outflow of R1.2bn reflected high inventories and supplier facility close‑outs.

Trading Statements & Updates
Boxer (BOX) Trading Update for 20W to 19 Jul ’26 (7576c)

Revenue/Turnover: +7.2% (like-for-like +2.2%)
Turnover growth slowed to 7.2% (vs 10.9% in H2 FY26), with like-for-like growth of 2.2%. Selling price deflation deepened to -1.9%, driven by double-digit declines in staple commodities such as maize meal, rice, and flour. Despite deflationary pressures, market share increased, supported by positive volume growth and strong other trading income. Nineteen new stores were opened (6 Superstores, 13 liquor outlets), with a pipeline targeting 25 Superstores and 35 liquor stores for FY27. Management expects turnover growth to accelerate in H2 FY27 as selling price inflation normalises and new stores contribute more meaningfully. Margin control remains tight, with trading profit margins expected to hold steady.
Woolworths (WHL) Trading Statement for 52W Jun ‘26 (4802c)

HEPS: 274.8–288.2c (↑2.5–7.5% from 268.1c)
EPS: 246.1–273.4c (↓10% to flat from 273.4c)
adHEPS: 306.4–321.6c (↑1–6% from 303.4c)
Revenue: Turnover & concession sales ↑4.3% (↑4.8% constant currency)
Gross Profit: Margin maintained despite fuel inflation & distribution costs
Group turnover grew 4.3% with Food up 5.7% and Fashion, Beauty & Home (FBH) up 4.4%. Online food sales rose 19.6%, contributing 7.3% of SA Food revenue. H2 momentum slowed sharply due to war-driven inflation, rate hikes, and weaker consumer demand, particularly in FBH. Country Road Group returned to profitability, aided by reduced discounting and brand repositioning. Share buybacks of 9.7m shares at R51.33 supported capital returns. CEO Sam Ngumeni noted resilience despite macro headwinds. Results due 2 Sep ‘26.

Glencore* (GLN) Half-Year Production Report for 6M Jun ’26 (11935c)
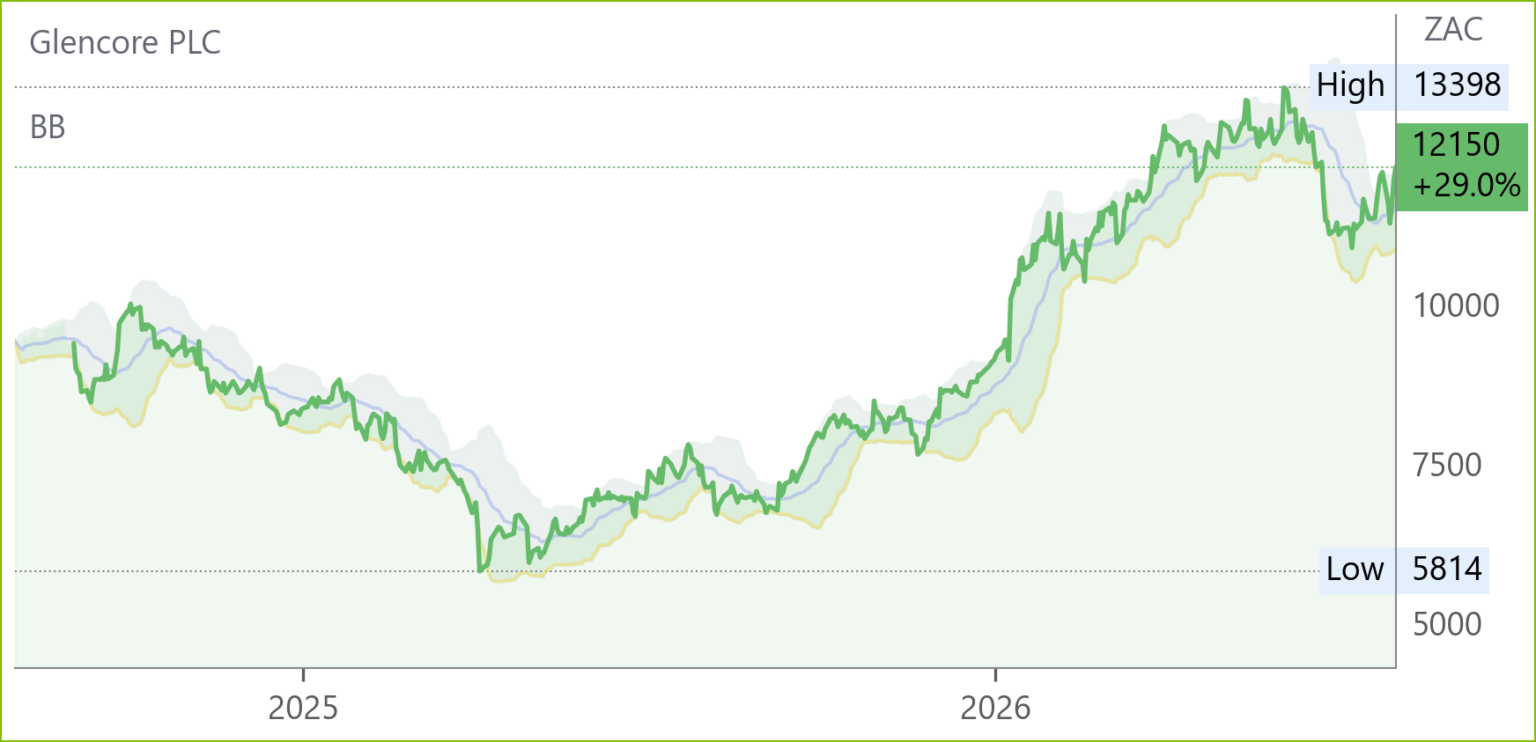
EBITDA: Marketing Adjusted EBIT c.$3.3bn (↑ from H1 ’25)
Copper output rose 15% to 397kt, driven by stronger African Copper and Antamina grades, offsetting the Mount Isa closure. Zinc fell 21% to 366kt due to Lady Loretta’s closure and lower grades at Antamina, while cobalt dropped 46% to 10kt under DRC export quotas. Coal production weakened: steelmaking coal down 14% to 13.5Mt, energy coal down 2% to 47.4Mt, reflecting curtailments at Cerrejón. Unit copper cash costs fell to 184c/lb (from 225c/lb), aided by higher volumes despite input cost inflation. CEO Gary Nagle stated: “We are pleased to report a strong production performance… key assets largely performed in line with expectations and guidance.” Guidance for copper, zinc, and nickel remains unchanged, with modest adjustments to coal. H2 is expected to deliver stronger volumes, supported by improved recoveries and sequencing.
Merafe (MRF) Trading Statement for 6M Jun ’26 (134c)

HEPS: 19.5c–22.0c (+55% to +75% from 12.6c)
EPS: 19.5c–21.4c (+110% to +130% from 9.3c)
Attributable ferrochrome production fell 75% to 28kt due to suspensions at Wonderkop, Boshoek, and partial suspension at Lion smelter. Chrome ore output slipped 4% to 425kt, while PGMs concentrate declined 5% to 6.7koz, reflecting weaker mine feed. Despite lower production, higher commodity prices and stronger sales volumes drove EPS and HEPS sharply higher. Cash balances rose to R1.59bn (from R1.16bn), including R410m set aside for rehabilitation obligations. Management highlighted resilience in navigating operational constraints and leveraging favourable market conditions. Results due 11 Aug ’26.
AVI (AVI) Trading Statement for FY26 (9011c)
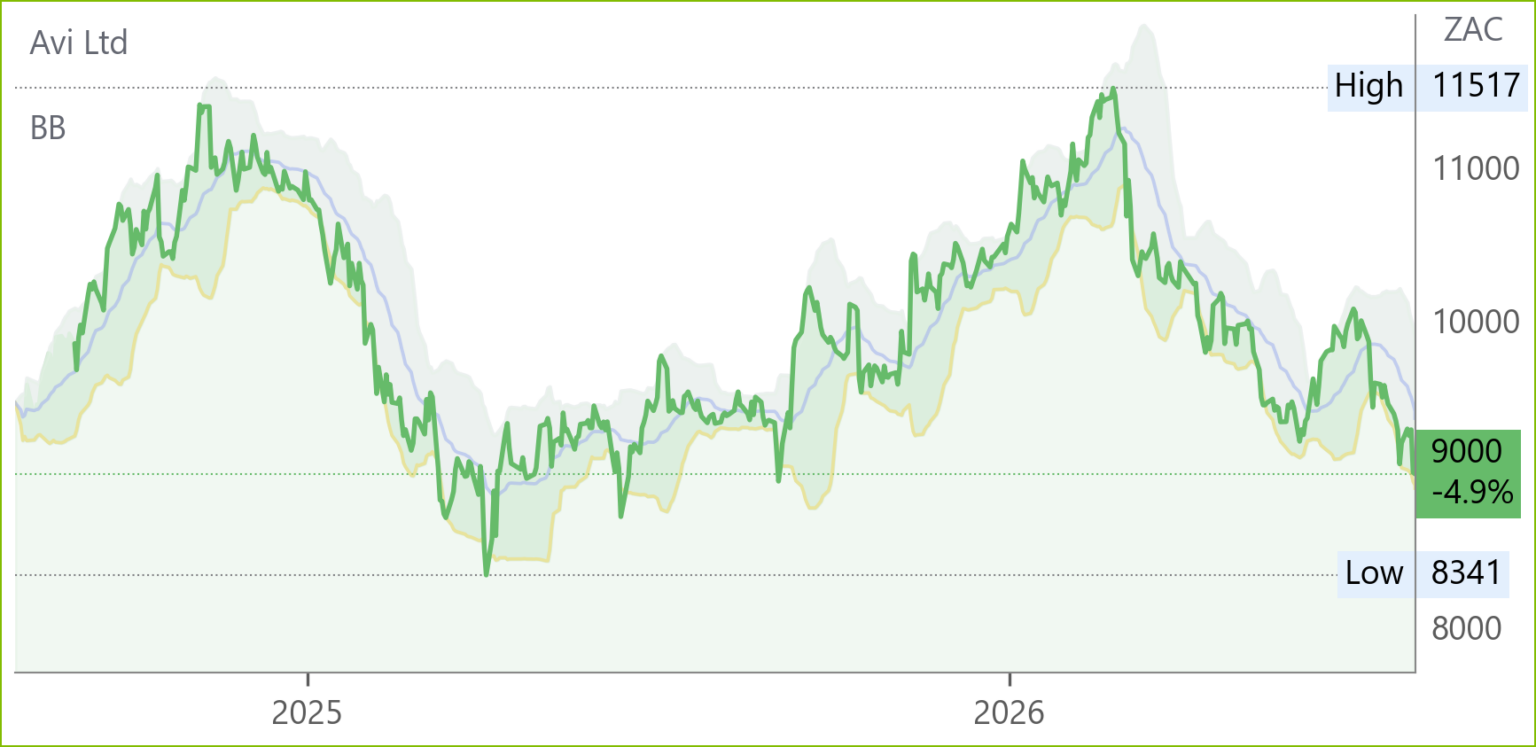
HEPS: 758.3–772.9c (↑4–6% from 729.1c)
EPS: 761.9–776.6c (↑4–6% from 732.6c)
Operating Profit: Improved, supported by 3.2% reduction in expenses
Revenue: R16 240m (↑1.4% from R16 021m)
Gross Profit: Increased, margins protected
Revenue grew 1.4% to R16.2bn, with Food & Beverage up 1.7% and I&J up 10.2%. Profitability improved across most categories, aided by restructuring savings and higher selling prices. Entyce faced margin pressure from aggressive competition in creamers, while I&J benefitted from stronger fishing volumes and new vessel capacity. Footwear delivered solid growth, supported by strong December trading. Consumer demand weakened in H2 due to higher fuel costs, interest rates, and unrest around 30 Jun ‘26. Results due 7 Sep ‘26.
Snippets
Labat Africa (LAB) announced an extension of its maiden dividend timetable following consultations with auditors during the annual audit finalisation. The dividend quantum remains unchanged, but implementation will now align with the release of audited annual financial statements. The Board emphasised that this adjustment ensures transparency, orderly administration, and shareholder protection, reinforcing its commitment to sound governance. Labat later clarified that its previously announced dividend timetable extension changes only the dividend payment date. Shareholders on the register at close of business on Friday, 31 Jul ‘26, remain entitled to receive the dividend.