
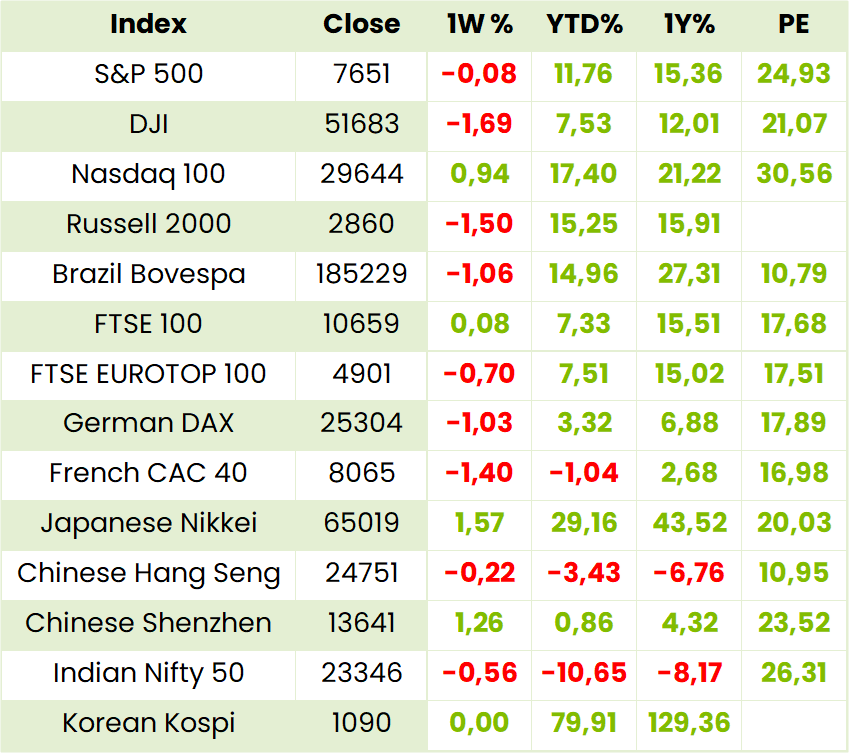
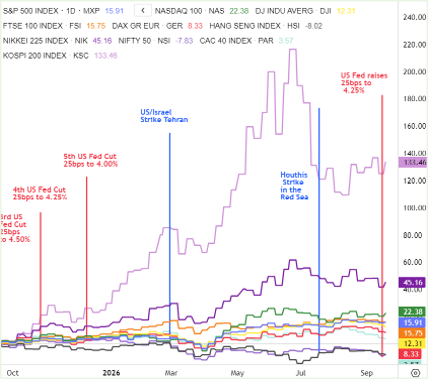
Global Indices
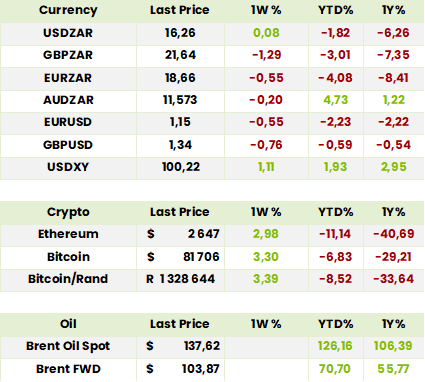
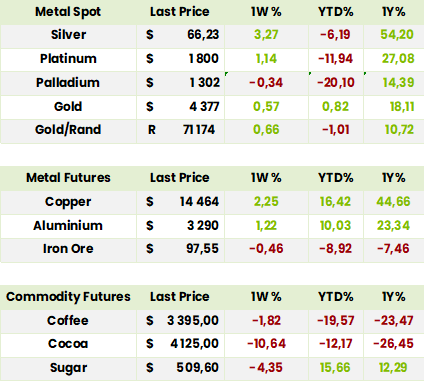
Currencies, Crypto & Commodities
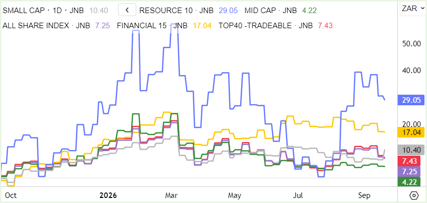
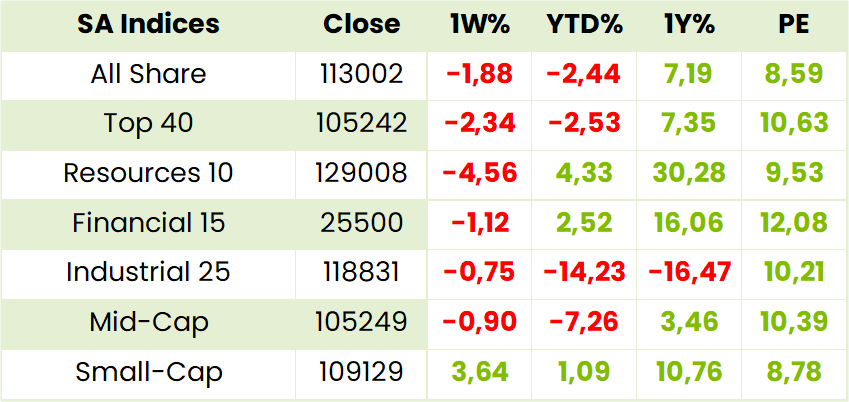
SA Indices
SA Upcoming Indicators & Dividends

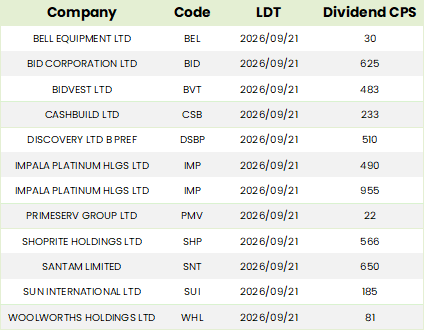

*holding in a Finova portfolio
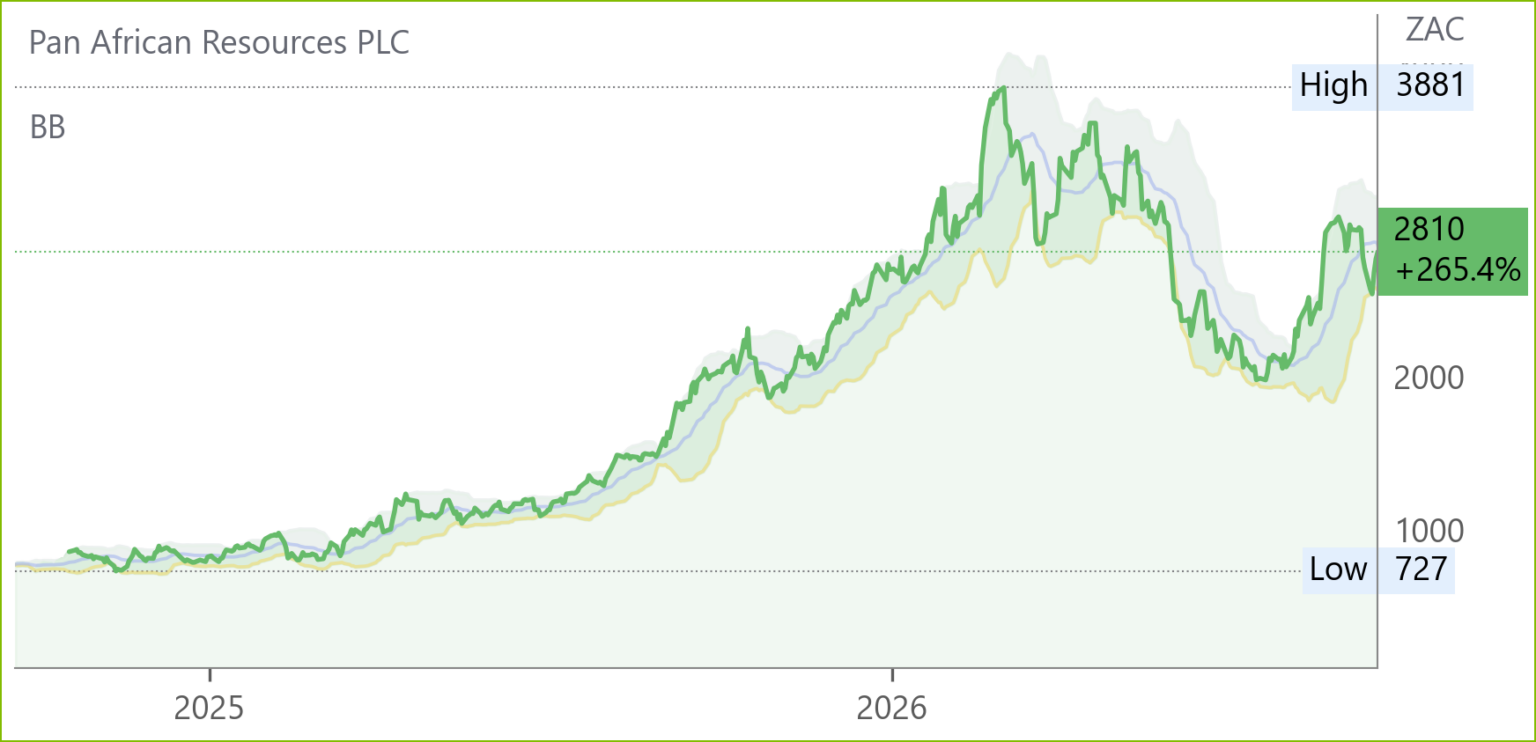
Pan African Resources (PAN) Financial Results FY26 (2810c)
HEPS: US 17.64c (+199.5% from US 5.89c)
EPS: US 17.60c (+145.8% from US 7.16c)
Operating Profit: US$356.9m (+153.8% from US$140.6m)
Revenue: US$1,156.5m (+114.2% from US$540.0m)
EBITDA: US$609.4m (+168.9% from US$226.6m)
Dividend: 77cps (final 65cps + interim 12cps)
Pan African delivered record FY26 results, with gold production up 38.6% to 272,310oz and revenue more than doubling to US$1.16bn, driven by higher gold prices and volumes. Net cash from operations surged 259.6% to US$557m, degearing the balance sheet into a net cash position of US$185.8m. The Group proposed a record dividend of 77cps and announced a ZAR500m share buy-back programme. Operational highlights included strong output from Elikhulu and Barberton Mines, commissioning of Mogale Tailings expansion, and Evander’s underground grade rising above 11g/t. Growth projects such as White Devil and Soweto Cluster underpin FY27 guidance of 280–302koz.
Comment: Panaf has grown production from 179koz in FY20 to 272koz in FY26 and, over the same period, PAT from $44.3m to $356.9m and Market cap from $739m to $4452m. Margin increased from 40% in FY20 to 126% in FY26 and, with its guidance for AISC FY27, after allowing for fuel and other cost increases, at between $2075 and $2175/oz, looks for further upside. Panaf mines underground at the 140+ year old Barberton Gold Mines and Evander Gold in Mpumalanga both of which have high grades. It has tailings retreatment operations at Elikhulu near Evander and Mogale near Soweto with another to follow there soon. In Australia it mines open pits and underground at Tennant mines with abundant scope for brownfields expansion in its 1700km² Northern Territory area. Despite steady progress Panaf is not in the big league with peers like Anglogold looking to produce between 2.8 and 3.17moz in FY12/26 and Goldfields between 2.4 and 2.6moz. It has nevertheless grown in stature and is now in the JSE Top 40, in the LSE 250. It is listed on the ASX and despite not having a US listing some 17% of its shares are held in the US and it is included in the Van Eck GDX Gold ETF. Despite the short lives of some of its operations there is plenty of scope for organic growth in its portfolio and CEO Kobus Loots stressed that there is no need at all to go hunting and overpaying for acquisitions. If gold merely holds above $4000 or soars above it the stock is a serious contender for inclusion in portfolios.

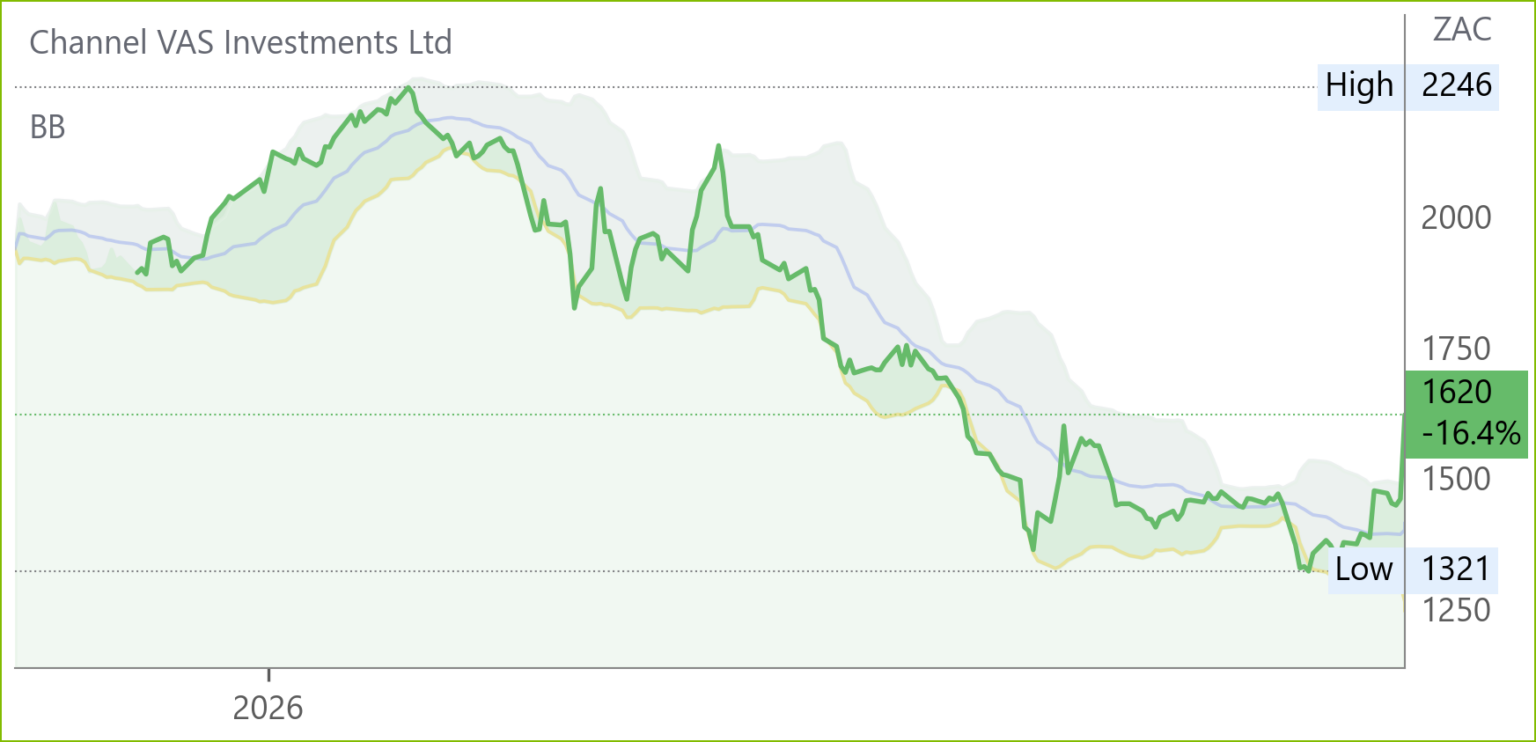
Optasia (OPA) Interim Results for 6M Jun ’26 (1620c)
HEPS: 2.79 US cps (+51% from 1.85 US cps)
EPS: 2.79 US cps (+51% from 1.85 US cps)
Operating Profit: $77.9m (+45% from $53.8m)
Revenue: $185.3m (+58% from $117.2m)
EBITDA: $77.9m (+45% from $53.8m)
Revenue surged 58% to $185.3m, driven by mobile financial services, which now contribute 72% of group revenue. Adjusted EBITDA rose 45% to $77.9m, while net income advanced 40% to $39.3m. Free cash flow improved sharply, up 150% to $32.7m, reflecting stronger cash conversion. Strategic expansion included new deployments in Gabon and South Sudan, the launch of merchant lending, and the acquisition of Finergi, extending into utility credit. Airtime credit services in Nigeria resumed under a multi‑provider model. FirstRand increased its stake to 26.1%, reinforcing collaboration with FNB. CEO Mark Muller stated: “We are confident in delivering 30–40% growth across revenue, EBITDA and net income for FY26.”
Comment: A strong period of reported growth from Optasia in revenue, operating profit and EPS. Having already met full year guidance in H1, they have further upgraded FY2026 guidance to 30-40% across revenue, adjusted EBITDA and normalised net income. Three segment deployments into Africa completed in H1, with another 11 in the pipeline. While all looks rosy on the surface, investors have not been convinced. The share price has declined 30% since the November 2025 IPO, a stark difference to the 61% YoY revenue growth. On a TTM basis, since Q4 2022, Optasia’s margins have almost halved. GPM% from 76.6 to 46.7; OPM% from 41.3 to 22.2; and NPM% from 27.2 to 15.8. Group CFO Mariusz Dabrowski highlighted operating costs and capex declining as a % of revenue, which should support margins but looking at the income statement, cost of revenue has doubled from 23.4% to 53.3% of revenue. Banking the “underbanked” emerging markets has a unique set of challenges, as defaults ticked up 20bps to 1.3% with the trend expected to continue per management. Considering core EPS has remained flat over 4 years, we’ll need to see how Optasia can protect their margins in the periods to come.

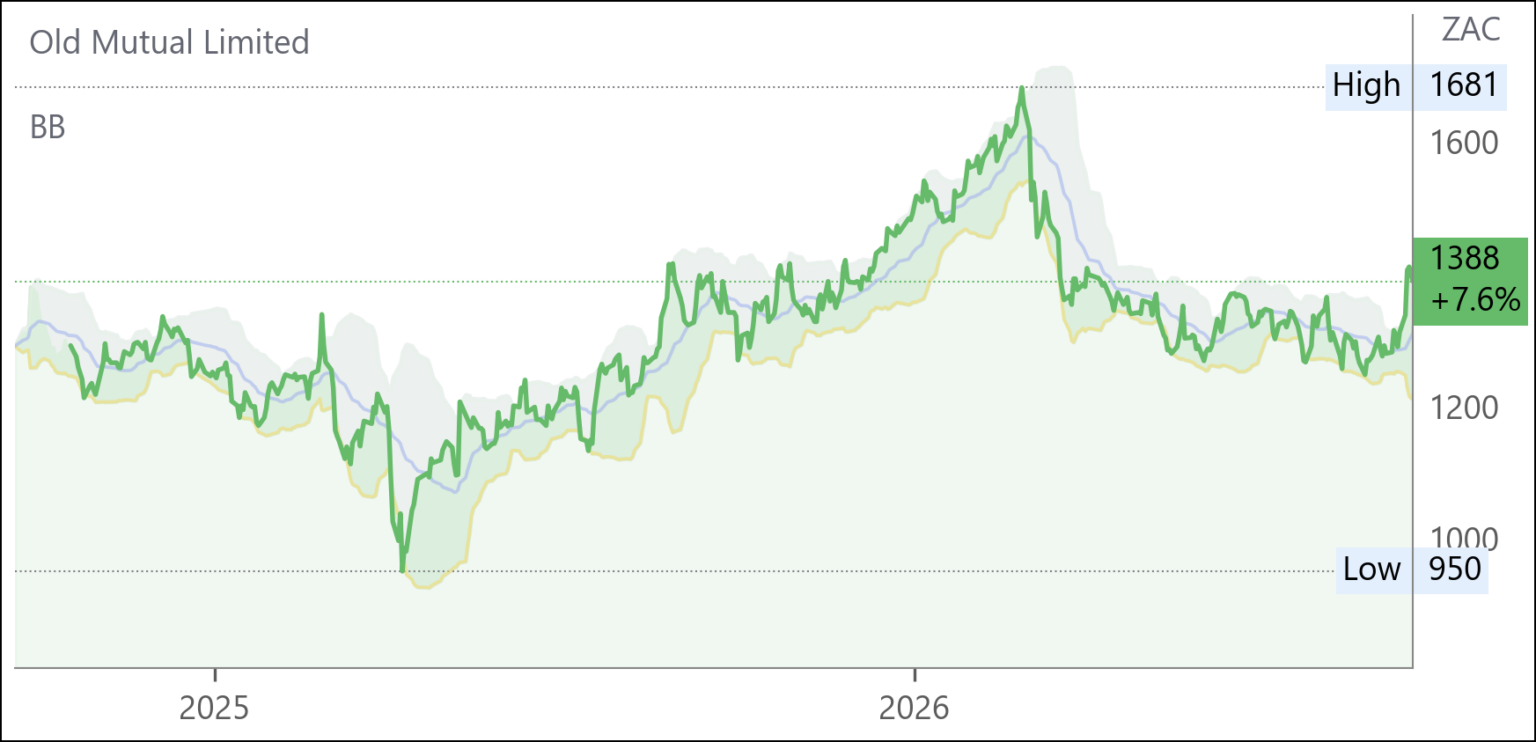
Old Mutual* (OMU) Interim Results for 6M Jun ’26 (1388c)
HEPS: 96.9c (–1% from 97.5c)
EPS: 95.8c (–0.3% from 96.1c)
Operating Profit (Results from operations): R5.28bn (+7% from R4.94bn)
Revenue: Gross flows R128.9bn (+21% from R106.8bn)
Dividend: 40c interim (+8% from 37c)
Life APE sales rose 21% to R7.9bn, with value of new business up 32% to R569m and margins improving to 1.4%. Wealth Management inflows and the inclusion of 10X Investments supported gross flows of R128.9bn. Net client cash outflows narrowed to R3.1bn from R10.1bn. Results from operations per share grew 11%, though adjusted headline earnings fell 27% to 70.6c due to weaker shareholder investment returns amid risk‑off markets. Group equity value per share increased 4% to R20.66, while solvency remained strong at 172%. The board declared an interim dividend of 40cps and approved a R1bn buyback. CEO Iain Williamson emphasised delivery on strategic priorities and resilience across core businesses.
Comment: Old Mutual’s 1H26 results show Adjusted HEPS down 27%, behind FY26e expectations of a 17% decline. Results from operations rose 7%, but quality is questionable, driven by inflation‑linked ROA and volatile investment gains. Segmental weakness in banking and short‑term insurance adds pressure, while cash remittances fell 53% YoY, reducing discretionary capital to R3.1bn despite a new R1bn buyback. With limited positives and weaker cash generation, we recommend switching into alternative financial investments offering stronger capital resilience.
Sanlam* (SLM) Interim Results for 6M Jun ’26 (8216c)

HEPS: 396c (↓15% from 465c)
EPS: 632c (↑29% from 490c)
Operating Profit: R7.29bn (↓7% from R7.86bn)
Revenue: R223.6bn new business volumes (+22% comparable)
Dividend: 90c interim (↑13% YoY)
NAV: 8401c (↓4% from 8773c)
Core earnings rose 1% on a comparable basis to R7.4bn, supported by strong life (+9%), investment management (+48%), and credit (+6%) earnings. General insurance was impacted by elevated weather‑related claims and weaker underwriting in Pan‑Africa. Net client cash flows surged 42% to R78bn, reflecting strong customer activity. IFRS attributable earnings rose 29% due to corporate gains, including the disposal of Sanlam Investments’ single asset manager and dilution gains from Shriram Finance. Management highlighted resilience despite macro headwinds, noting adjusted RoE at 18.4% and solvency cover at 177%. Sanlam expects continued growth in Africa and India, supported by digital distribution, improved cash conversion, and dividend capacity despite weather‑related claims and weaker shareholder returns.
Comment: As CEO Paul Hanratty said in regard to the massive weather related payouts “That’s what we’re there for!” while the stronger ZAR reduced reported foreign earnings. As for the latter it worth noting that, in pushing the holding in Shriram Life up to 69% from 42% and in Shriram General Insurance to 51% from 40.25% Sanlam will benefit from the support of India’s largest Non-Banking Financial Company. Shriram has a market cap of ZAR 440bn and has itself has benefited from an equity injection from Mitsubishi UFJ Financial group of USD 4.4bn to facilitate anticipated loan book growth of 18 to 20% per annum courtesy of its massive bricks and mortar network of 3225 branches across India. This provides a distribution channel for the Sanlam designed life and general insurance products. Moreover, after three years, the Pan African JV with Allianz, paid a dividend (Sanlam’s share was R255m) which is expected to be followed by a growing stream as operations expand over 25 countries. Sanlam therefore provides a useful option for international as well as local investors seeking to benefit from accelerating economic growth in both Africa and India.
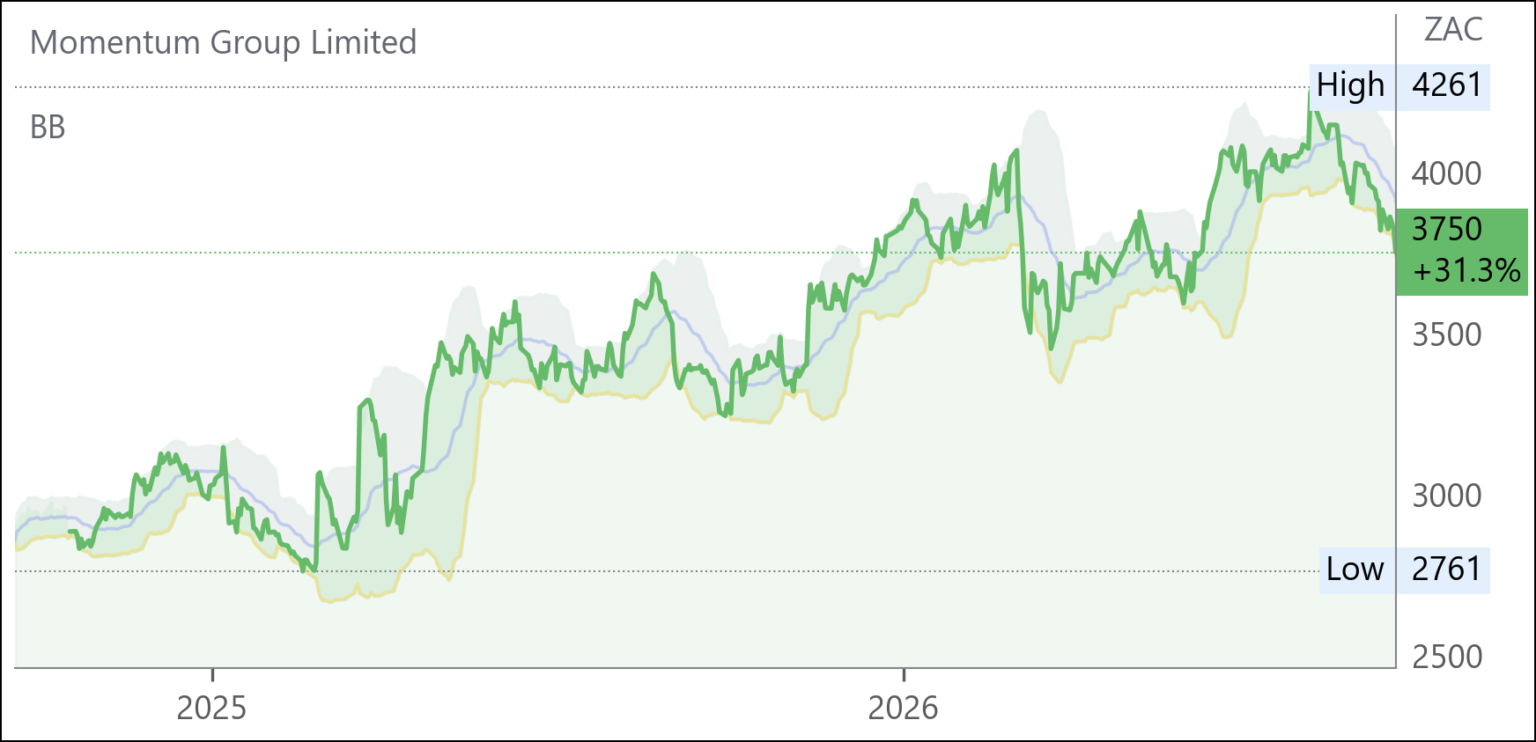
Momentum* (MTM) Financial Results FY26 (3750c)
HEPS: 528.7c (+18% from 446.9c)
EPS: 516.2c (+16% from 445.1c)
Operating Profit: R5,971m (+9% from R5,481m)
Dividend: 230cps (final 120cps + interim 110cps)
Momentum delivered record FY26 results, achieving normalised headline earnings of R7.06bn, surpassing its Impact strategy target a year early. NHE per share rose 18% to 530c, supported by strong contributions from Momentum Investments, Metropolitan Life, Guardrisk, and Momentum Corporate. Embedded value per share climbed 19% to R50.60, with ROE at 21.7%. A R1bn share buy-back programme added R388m in value for shareholders. The Group declared a total dividend of 230cps, up 31% year-on-year, representing a 43% payout ratio. Operational highlights included improved persistency in retail, strong annuity profits, and positive mortality experience. Non-life earnings benefited from favourable underwriting in Guardrisk and Momentum Insure. CEO Jeanette Marais noted the Group’s resilience and commitment to deepening adviser relationships while leveraging AI and automation to enhance efficiency. Comment: Momentum’s nine year growth can be seen as a Story of Three Strategies the first of which was the internally focused “Rest and Grow” (2018 -2021) implemented by Hillie Meyer who was appointed after a period of declining earnings and challenges following the integration of Metropolitan. So, it was a back to basics model empowering independent operation of businesses and exiting unprofitable African markets such as Nigeria, Kenya and Tanzania. “Reinvent and Grow” followed in 2022 with the focus on market expansion and digital innovation. Jeanette Marais, who took over as CEO in 2023 launched the Impact strategy in 2025 which she credits with the shoot the lights out FY26 results with everybody crystal clear about and inspired with, their targets instead of chasing arbitrarily selected numbers. Be that as it may, it is also worth noting that Jeanette Marais, who had been with Momentum prior to the disastrous centralisation model implemented after the takeover of Metropolitan, was called back to the company by Hillie Meyer to help turn it around. Investors are therefore entitled to believe the changes she envisages now are indeed necessary and will be beneficial. Consequently, the stock, on a generous DY and modest PE, may safely be held for steady growth.
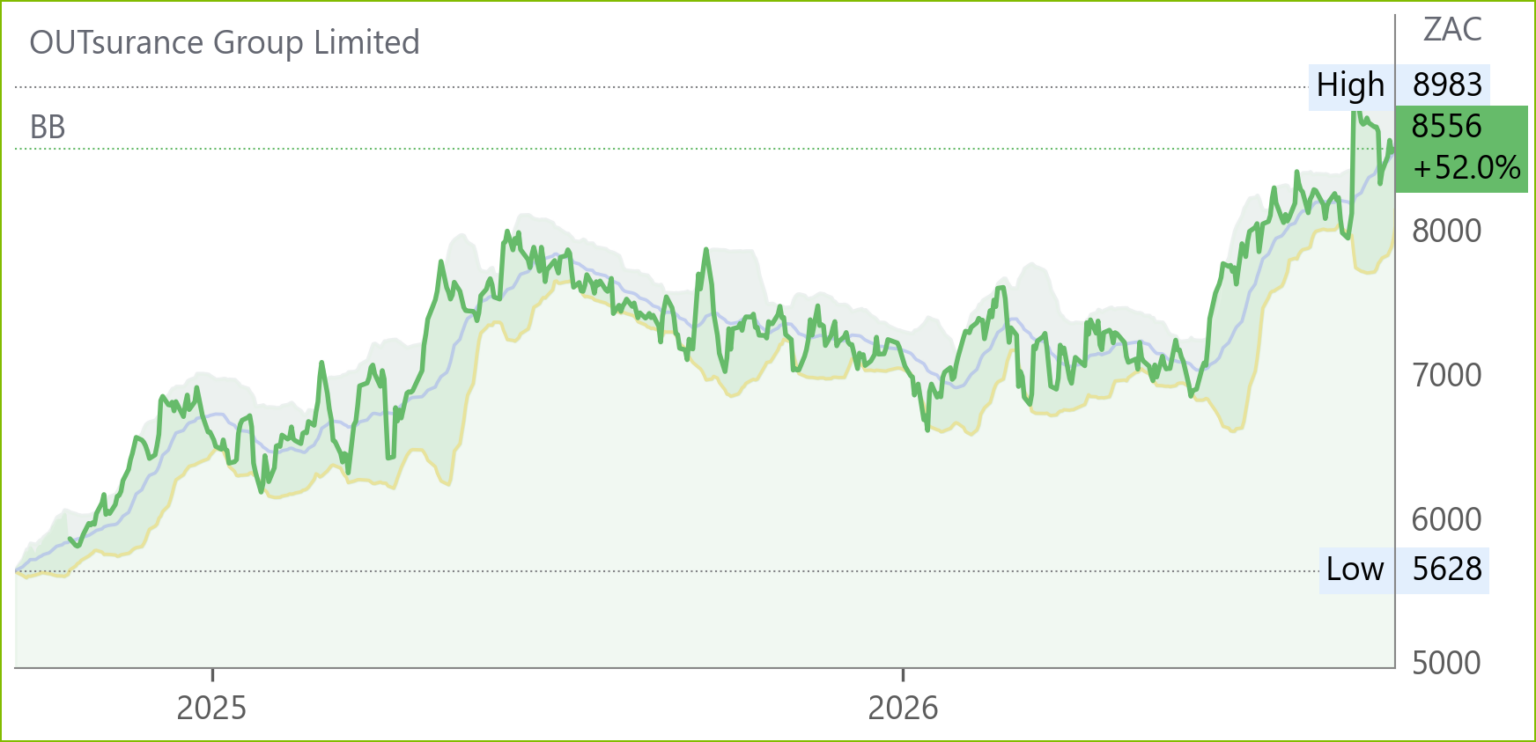
OUTsurance (OUT) Financial Results FY26 (8556c)
HEPS: 368.5c (+23.5% from 298.3c)
EPS: 365.2c (+19.3% from 306.2c)
Operating Profit: R8.65bn (+12.6% from R7.68bn)
Revenue: R41.49bn (+11.7% from R37.13bn)
Dividend: 291.5c ordinary (+22.7% YoY) and 117.8c special (>100% YoY)
Normalised earnings rose 18.5% to R5.61bn, driven by strong South African property and casualty operations (+43.3%) and OUTsurance Life (+41.5% new business growth). Youi’s solid performance was offset by elevated natural peril claims, while OUTsurance Ireland reduced its operating loss profile. The replacement of the ESOP with a Conditional Share Plan lowered share‑based payment expenses, stabilising earnings. Chairman Herman Bosman and CEO Marthinus Visser emphasised the Group’s diversified base and agility, noting, “Our disciplined underwriting culture and focus on customer outcomes position us well to navigate changing market conditions.”
Comment: the Outsurance share price broke out over R50 two years ago when it became apparent that the many years of establishing itself and Youi in Australia were going to pay off. Youi has become a household name and is rated among the top three Australian insurers. A similar phenomenon is likely in Ireland although, with its population of 5.5 million as against Australia’s 28 million, it will not be so marked. The market liked the discontinuation of the ESOP scheme and that together with the possibility of less elevated natural perils claims in Australia, bodes well for the current year. That said, the stock is on a remarkably high rating so, while it should certainly be held, there may be better buying opportunities to come.

Orion Minerals (ORN) Annual Results FY26 (29c)

HEPS: ‑AUc0.12 (+33% from ‑AUc0.18c)
EPS: ‑AUc0.12 (+33% from ‑AUc0.18c)
Operating Profit: Loss AUD12.69m (improved from loss AUD15.36m)
Orion Minerals advanced its Northern Cape copper and zinc hubs during FY26, narrowing losses as HEPS and EPS remained negative in AUD terms. At Prieska Copper Zinc Mine, a US$250m prepayment facility with Glencore was secured, with Reserve Bank approval enabling staged drawdowns for Uppers and Deeps development. The IDC partially converted debt into equity, strengthening the balance sheet. Okiep Copper Project achieved dewatering at Flat Mine North, opening historic workings, while drilling at Flat Mine East confirmed high‑grade copper continuity with intercepts up to 17.1% Cu. CEO Tony Lennox emphasised Orion’s transition to developer status, targeting first concentrate within 13 months of funding availability. Comment: the pre-production life of a developer is not easy as evidenced by the Orion share price which, aside from some spurts and dives in between, is not far above what it was nine years ago in September 2017. Some over optimistic forecasts of the commencement of copper concentrate production haven’t helped either. The tide may well, however, be about to turn from the situation at 30 June 2026 when, after a FY 06/26 loss of $12.7m (USD12c or ~ZAR 195c) the balance sheet reflected assets of $173m including $91m “deferred exploration evaluation and development,” and $14.5m in cash. Net Assets and Equity were $120m (USD1.75cps). As against this there are many positives including a board and management comprising seasoned and competent copper industry veterans. The FY26 Annual Report cites in its Investment Case:(1) estimated after tax value of flagship Prieska project $586m = ~ZAR 98cps (2) low production cost $2070/t ~v current $14225/t (3) The scale and quality of the Prieska resource support a long-life production opportunity, with further potential to extend the resource through exploration. (4) Historic Production: Prieska historically delivered 430kt Cu and 1Mt Zn, while Okiep district produced in excess of 2Mt Cu (5). Estimated post-tax net present value of the Okiep Copper Project of~ZAR 867m (or ~ZAR 13cps) (6) EXPLORATION UPSIDE ~70% of the exposed Areachap Belt ~75% of the exposed Okiep District. Significant exposure to two underexplored copper districts in the Northern Cape provides potential for new discoveries and resource growth.
In addition, important players are showing interest and support: the IDC has taken 21% equity in the New Okiep Mine and BHP Group, in addition, to being vocal about its support for the Northern Cape venture invited management to participate in a showcase BHP Xplor event in New York on 17 September where many mining startups set up their stalls for the day and presented to scores of smaller institutions, family investment offices, and private equity. Moreover, Glencore has signed an agreement, approved by the Reserve Bank, whereby it will, subject to certain conditions, advance between $200 and $250m for the development of Prieska and get offtake of copper production. Management is also presenting at investor conferences in North America and Australia. Management currently expects the first concentrate from Prieska in January 2028 by which time progress in obtaining further funding should be evident as well as meaningful progress in exploration. Bottom line: the stock is probably undervalued but investors can afford to be patient and await the Glencore payment and further endorsement by banks.

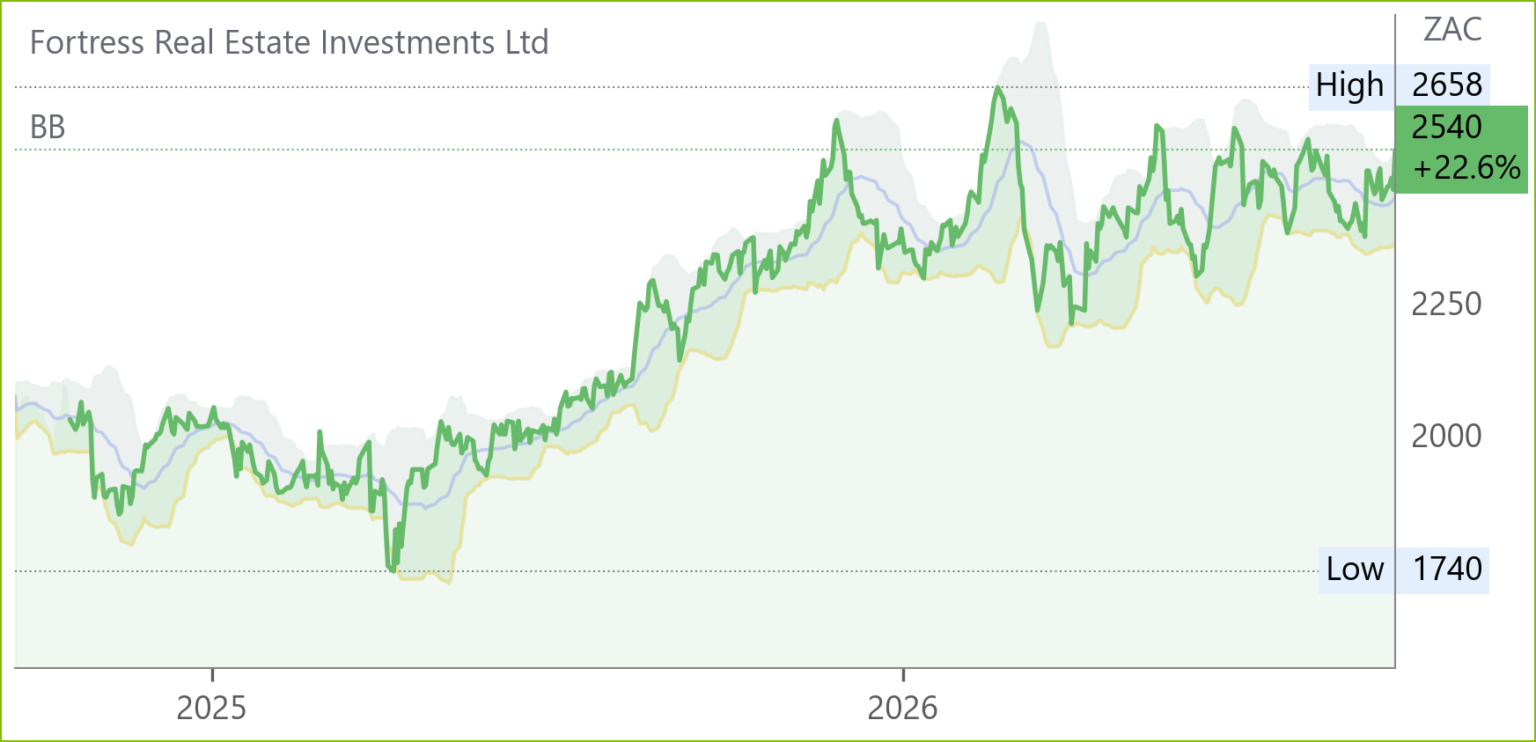
Fortress REIT (FFB) Financial Results FY26 (2540c)
HEPS: 263.7c (+633% from 36.0c)
EPS: 417.0c (+87% from 222.9c)
Revenue: R6.24bn (+3.7% from R6.02bn)
EBITDA: Funds from operations R2.18bn (+12.6% from R1.93bn)
Dividend: 178.8cps (87.9c interim + 90.9c final)
NAV: R27.02/share (+6.9% from R25.27)
LTV: 34.0% (improved from 39.1%)
Distributable earnings rose 14.2% to R2.23bn, supported by 6.8% like‑for‑like NOI growth across logistics and retail portfolios. NAV per share increased 6.9% to R27.02, while LTV improved to 34%. Fortress raised R1.35bn equity to fund its R4.6bn logistics pipeline without asset disposals. CEO Steven Brown highlighted portfolio recycling, with R11.6bn of disposals since 2019 redeployed into R17.5bn of developments and acquisitions. The board declared a final dividend of 90.9cps, lifting the FY payout to 178.8cps. FY27 distributable earnings guidance was revised upward to R2.46bn, equating to ~R1.92/share (+7.5%).
Comment: The Fortress portfolio remains well diversified across logistics and retail, currently a 50/50 split, but targeting a two-thirds weighting in logistic real estate. Growth in recent years came from the robust development pipeline, which has historically been funded through disposals of non-core assets. Having developed >122k GLA annually since 2019, the development pipeline has shrunk from >1mil GLA to 169k GLA. CEO Steven Brown indicated funding the existing pipeline can be funded with debt, only raising LTV to 40%. He expects to source >500k GLA in development pipeline over the next 3-5 years. Finding land that is economically viable to develop is a related constraint here, Executive Director Vuso Majija noted that the strategy is to hold high quality assets and dispose of the low quality, which has a finite pool (also the strategy competitors are following). If Fortress can’t source enough development for the pipeline long term, they risk being reclassified as a REIT. Solar implementation added 130bps to like-for-like NOI growth in direct SA retail, while solar across logistics has fully met their tenants operating requirements, ultimately reducing reliance on Eskom, which reduces business risk. CEO Steven Brown further mentioned the possibility of a 20 year PPA with City of Ekhurleni to use additional solar capacity to the grid – a positive for the ESG score. With a 14.4% stake in NEPI and group vacancy rates trending lower, the stock remains attractive below 2400c, the strike price management has set on the scrip dividend alternative.
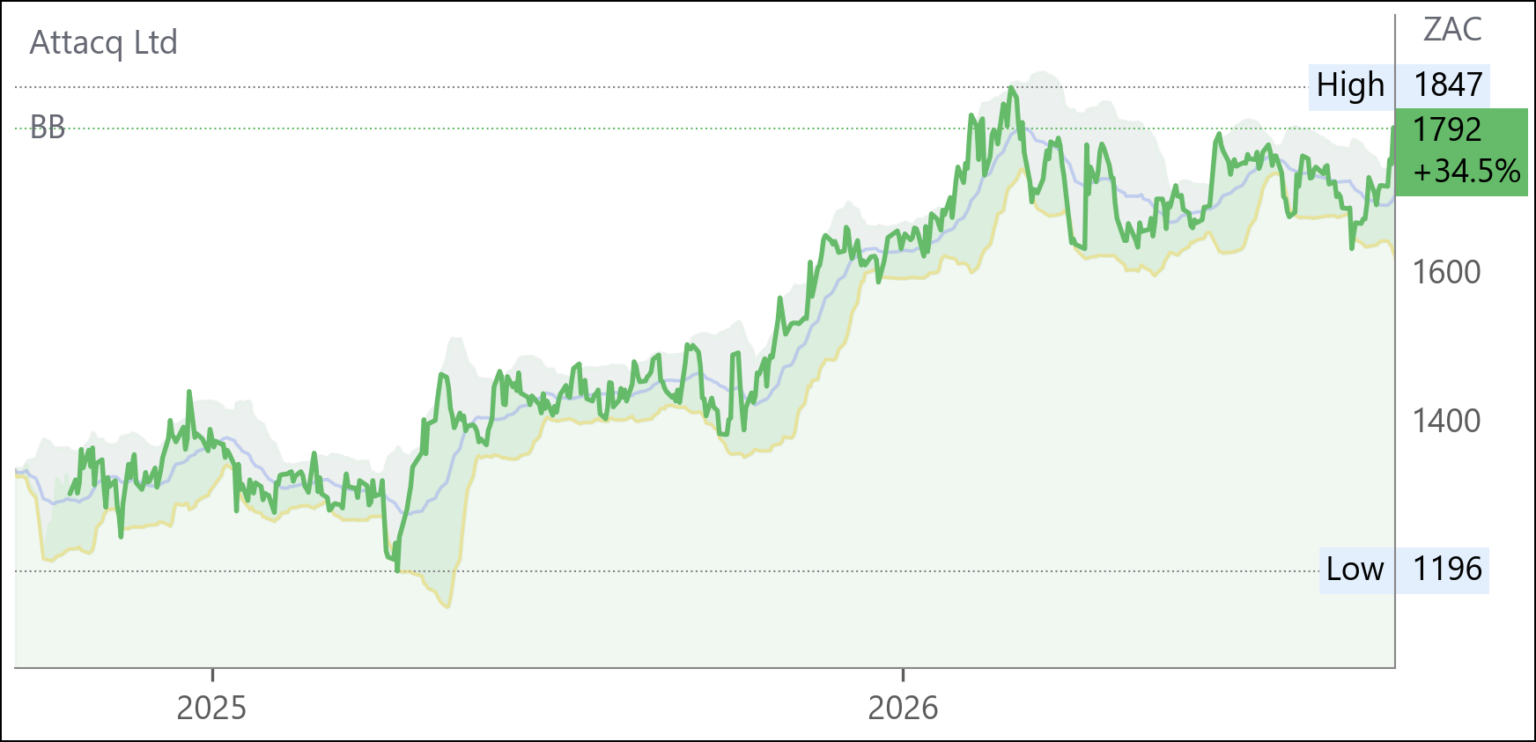
Attacq (ATT) Financial Results FY26 (1792c)
HEPS: 99.8c (↓ 2.4% from FY25)
EPS: 206.3c (↓ 3.8% from FY25)
DIPS: 125.1c (↑ 15.5% from FY25)
Operating Profit (NOI): R1.45bn (↑ 7.0%)
Revenue: R3.13bn (↑ 9.3%)
Gross Profit: R2.1bn (↑ 10%)
EBITDA: R1.6bn (↑ 11%)
Dividend: 102.0c per share (final, ↑ 17.2%)
LTV: 25.0% (↓ from 25.3%)
NAV: 2004c per share (↑ 5.8%)
Attacq delivered resilient FY26 results, with DIPS up 15.5% to 125.1c, supported by rental escalations, improved occupancy (94.9%) and income from new developments including the Vantage data centre and Galileo residential tower. Rooftop PV installations contributed to cost savings, while gearing remained stable at 25%. Dividend payout ratio was 80.3%. Guidance for FY27 indicates DIPS growth of 6–9%, driven by NOI growth, disciplined cost management and further PV expansion. CEO Jackie van Niekerk emphasised: “Our diversified portfolio and disciplined capital allocation continue to underpin sustainable growth.”

Trading Statements & Updates
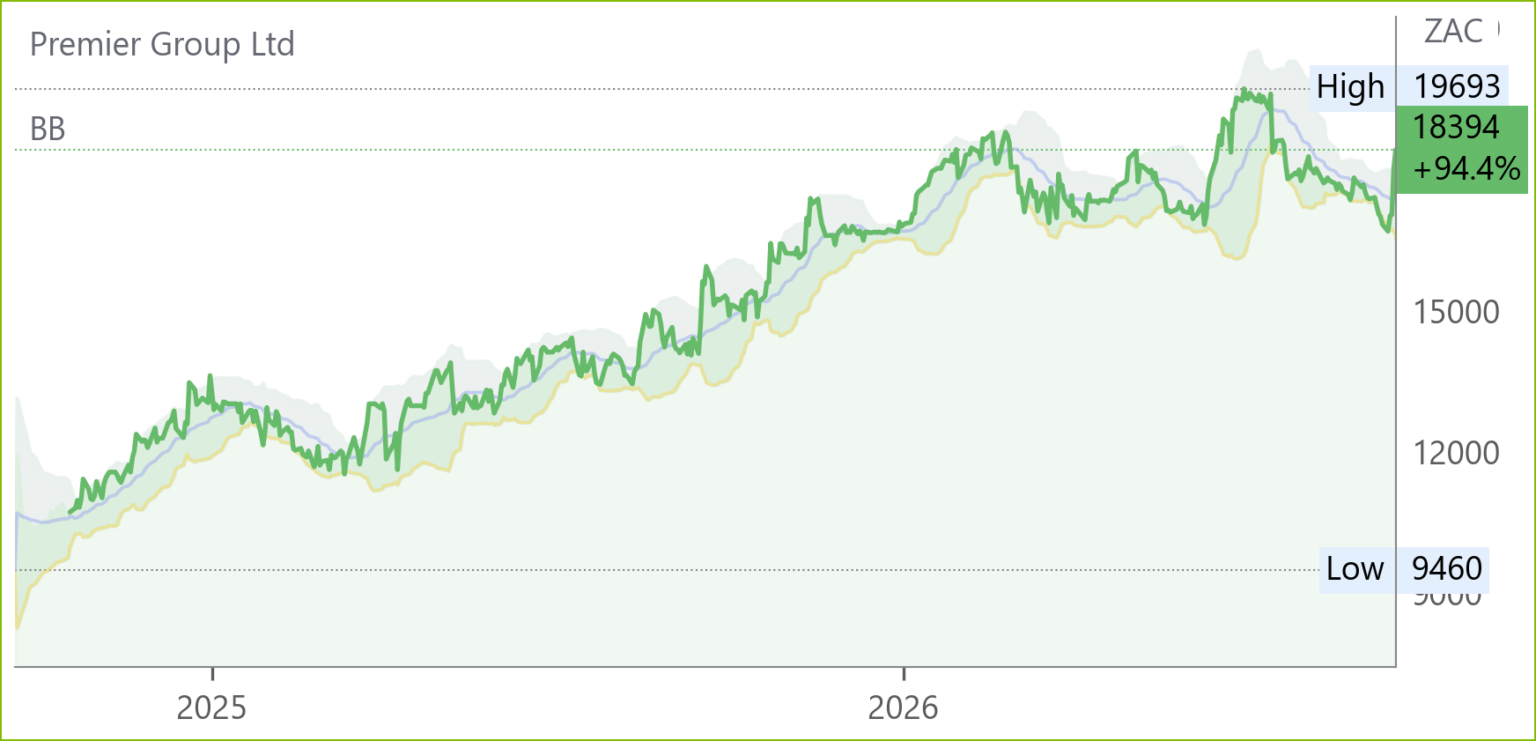
Premier (PMR) Trading Statement 6M Sep ’26 (18394c)
HEPS: 683–739c (↑ 22–32% from 560c)
EPS: 681–736c (↑ 22–32% from 558c)
Revenue: ↑ 35–45% (boosted by RFG acquisition)
Operating Profit: uplift from volume growth and efficiencies
Premier expects strong H1-FY27 earnings growth, driven by the integration of RFG Holdings into its new culinary division and sustained volume growth across categories. New bakeries at Aeroton and Middelburg enhanced capacity, replacing older facilities and improving logistics. The Fruit Processing Western Cape unit will not reopen due to global industry decline, with mitigation measures including potential contract transfers to Langeberg Foods and pulp processing at Groot Drakenstein. Share repurchases in March and July reduced issued capital by over 2%, supporting EPS growth. Results due 10 Nov ’26.
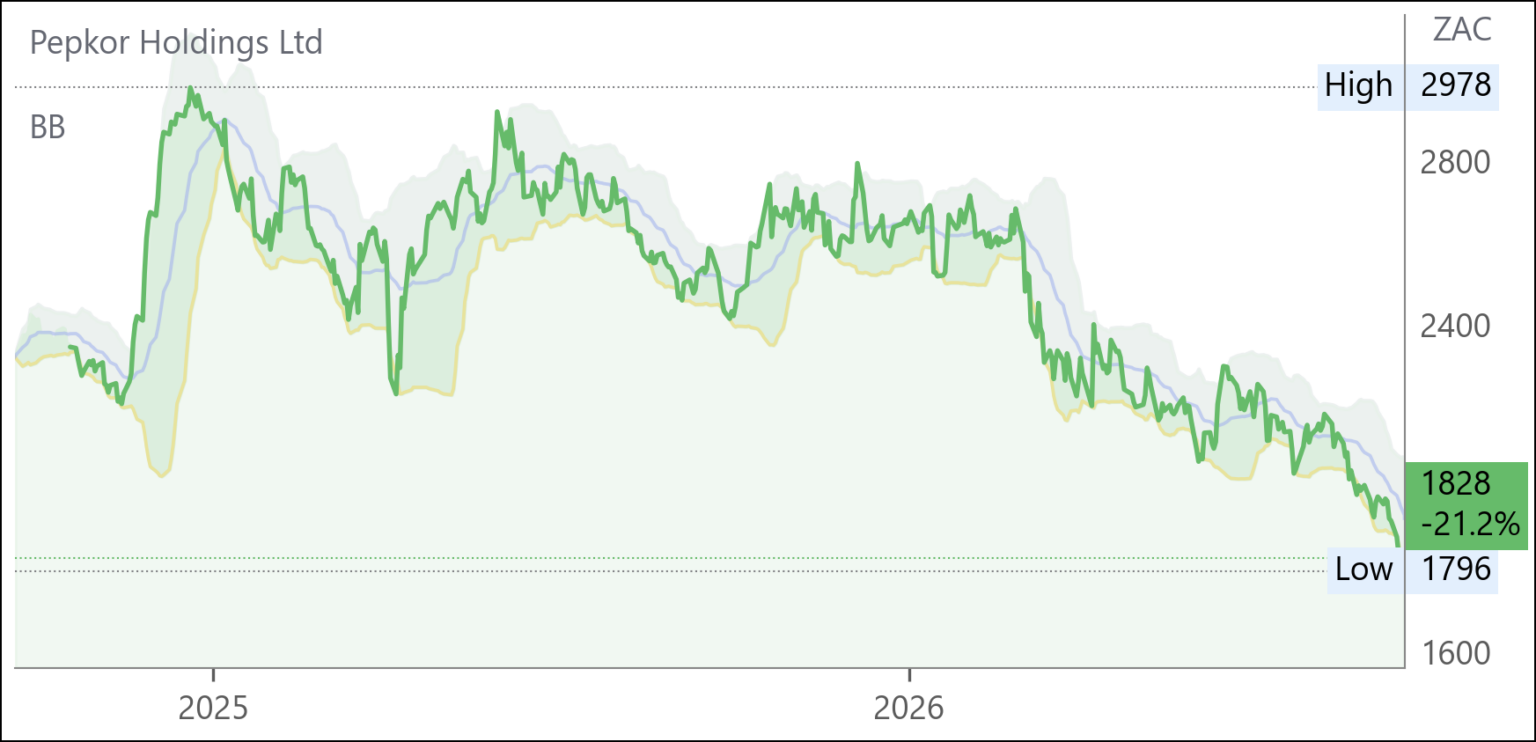
Pepkor (PPH) Business Update for 10M FY26 (1828c)
HEPS: 155.7–171.8c (‑3% to +7% from 161.0c)
EPS: 146.3–161.6c (‑4% to +6% from 153.0c)
Revenue: R89.2bn (+11.9%; +7.3% excl. acquisitions)
Gross Profit: Margin improved
Revenue grew 11.9% to R89.2bn, supported by 3.1% like‑for‑like sales and market share gains in PEP. Furniture, appliances and electronics advanced 16.3%, while Speciality and Avenida exceeded expectations. Online sales surged 38.9%, and Flash throughput rose 19% to R58.4bn. A R2bn sale‑and‑leaseback of distribution centres strengthened liquidity. COO succession was announced, with Garth Napier succeeding Sean Cardinaal from Jan ’27. Management cautions FY26 earnings growth will be moderated by a subdued retail environment, high base effects, and investment in PlusB banking. Medium‑term HEPS growth guidance of 10–15% for FY27+ reaffirmed.
Jubilee Metals (JBL) Operational Update FY26 (47c)
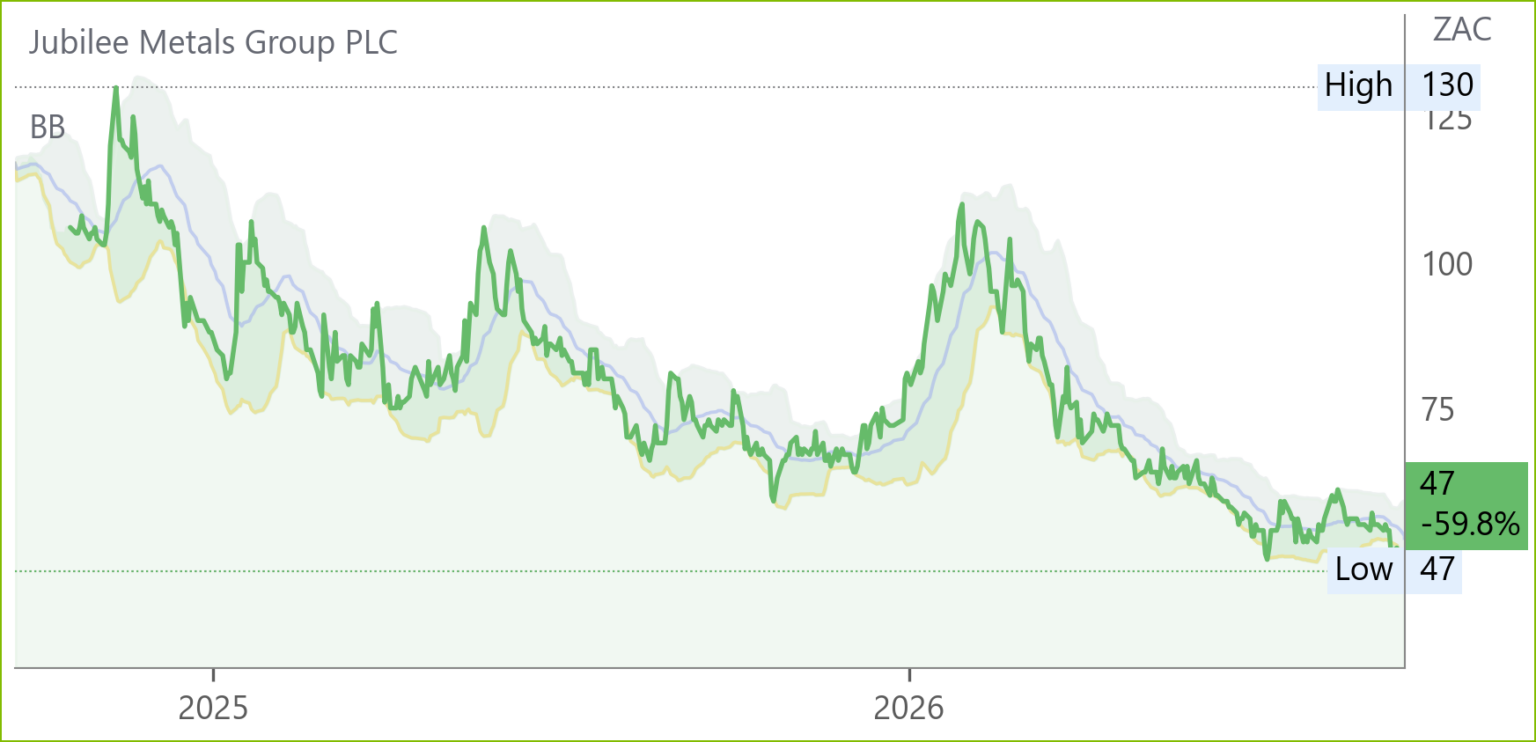
Copper production rose 225% to 3 739t, with Roan contributing 2 823t (+146%) and Molefe delivering 916t following its Sep ’25 commissioning. Refined copper output at Sable increased 17.5% to 1 207t, despite acid costs rising over 200% and diesel up 90%. Molefe advanced its pre‑stripping programme, removing 456 511t to support a 10 000tpm HG ROM feed at 1.45% Cu by end CY’26. Project G is scheduled to commence Feb ’27. Jubilee disposed of its Large Waste Project for up to $35m, sharpening its three‑pillar copper strategy. CEO Leon Coetzer noted Jubilee’s transition into an integrated mine‑to‑metals copper business, with Roan providing stable guidance of 2 850–3 150tpa.
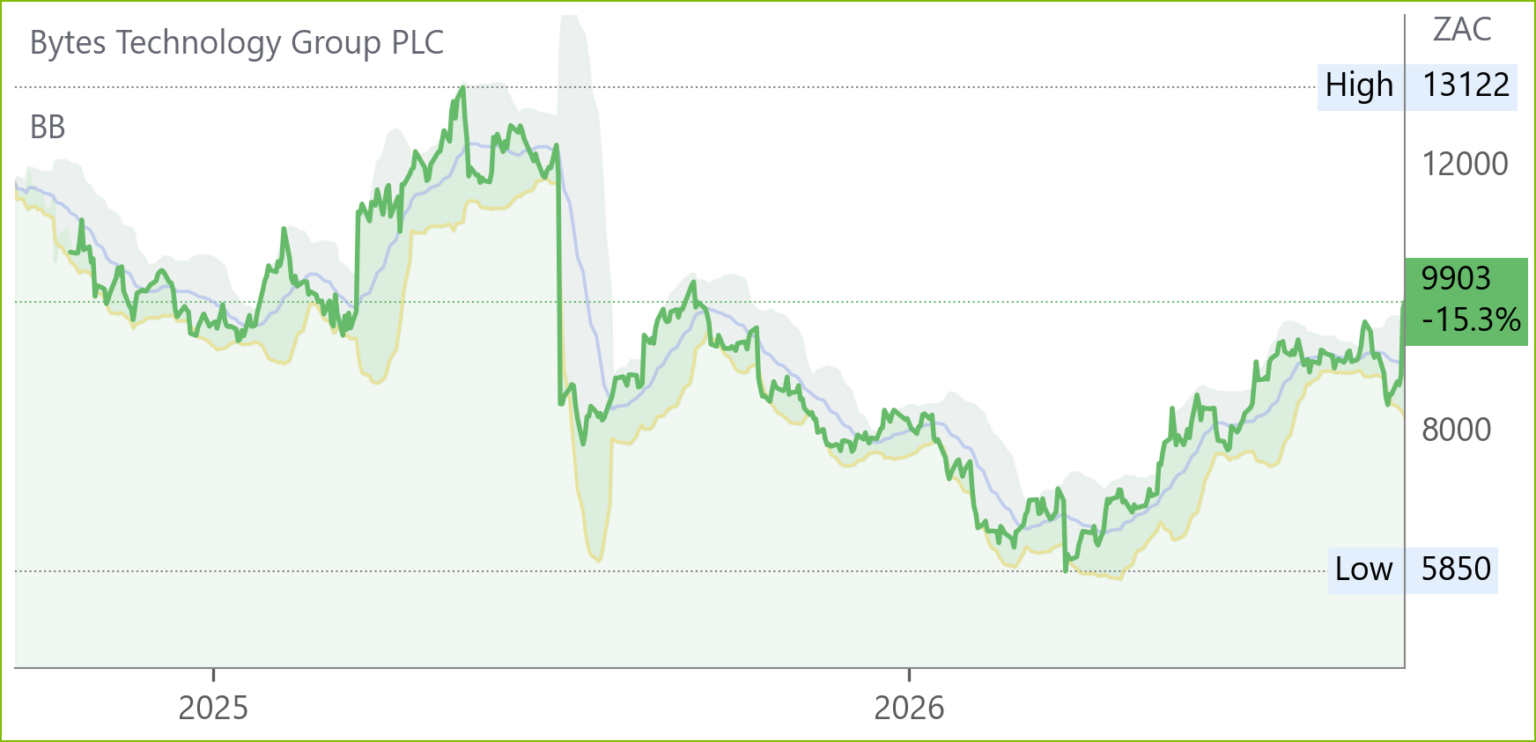
Bytes Technology Group (BYI) Trading Update H1 FY27 (9903c)
Operating Profit: +6% year-on-year
Gross Profit: +18% year-on-year
Dividend: FY26 final dividend £16.3m already paid
Bytes Technology Group traded ahead of expectations in H1 FY27, with gross invoiced income up c.19% and gross profit up c.18%. Operating profit rose 6%, reflecting cost normalisation from strategic projects and bonus adjustments. Net cash stood at c.£68m after £41.3m was returned to shareholders via dividends and buybacks. Cash conversion improved to 45% (H1 FY26: 34%), consistent with the Group’s second-half weighting. CEO Sam Mudd noted: “Customer demand for software, cloud and security solutions has remained strong, and AI is becoming a more meaningful driver of growth in our core business areas.” Interim results due 13 Oct ’26.
Snippets
Solar SA will acquire all Omnia (OMN) shares at R134.50 via a scheme of arrangement, valuing Omnia at R21.8bn. The offer carries premiums of 31% to the pre‑cautionary close and 71% to Dec ’25 levels. Omnia will be delisted from the JSE and A2X, with completion expected by 31 Jul ’27 subject to approvals. The deal strengthens Omnia’s mining and agriculture businesses through Solar’s global footprint, capital access and technology transfer, while representing significant foreign direct investment into South Africa. Solar intends to use Omnia’s SA operations as a hub for African expansion and will support B‑BBEE and socio‑economic initiatives.