
Global Indices


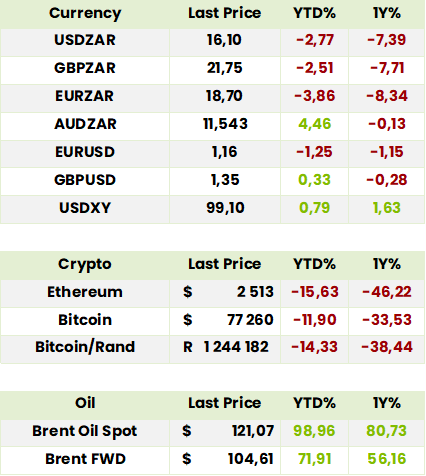
Currencies, Crypto & Commodities

SA Indices


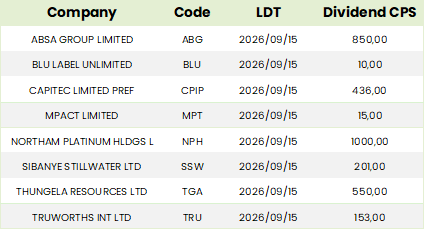
SA Upcoming Indicators & Dividends


*holding in a Finova portfolio
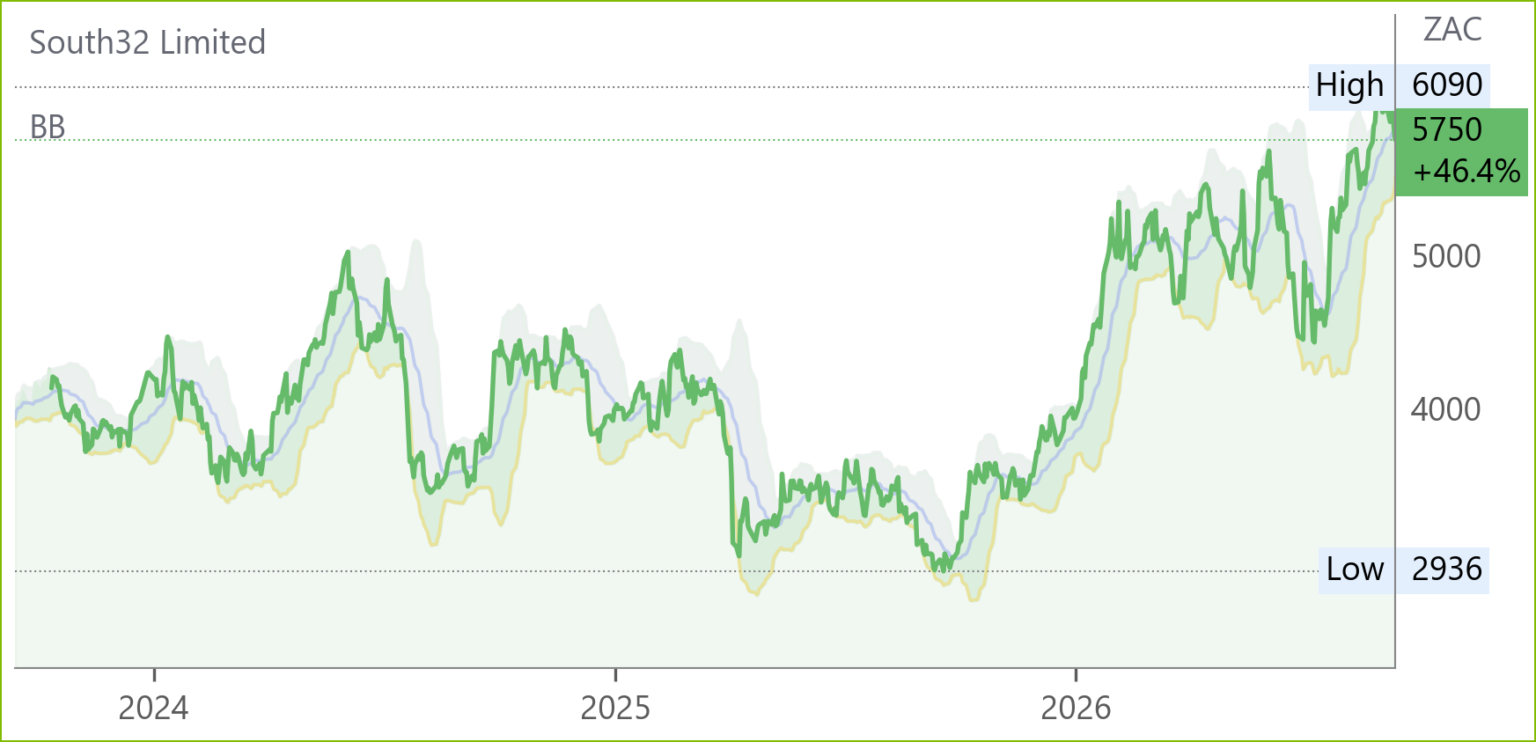
South32 (S32) Financial Results FY26 (5750c)
HEPS: US¢24.0 (+ 194% from US¢ 12.4)
Operating Profit: US$1359m (145.3% up from R554m)
Revenue: US$ 5.46bn (+1.01% from US$5384m)
EBITDA: US$2.5bn (+28% from US$1.95bn)
Dividend: 5.4cps final (US$242m; FY payout 40% of underlying earnings): interim was 3.9c
Base‑metals operations drove earnings growth, with EBITDA up 28% and underlying earnings rising 55% to US$1bn. Net cash flow from operations increased by US$ 299m to US$1634m, despite US$700m invested in Hermosa. Net cash closed at US$2134m (after US$327m was returned to shareholders please check). ROIC increased to 13.6% from 9.0%. A binding US$5.6bn sale of aluminium assets to Alcoa will reposition South32 as a copper‑ and zinc‑focused producer. Hermosa construction remains on track, while Sierra Gorda’s ore reserve rose 61% to 1.1bn tonnes, extending mine life to 19 years. CEO Matt Daley said: “Securing the Alcoa transaction unlocks significant value and positions South32 as the leading base metals company on the ASX.”
Comment: after the transaction, which completely reshapes South 32, underlying ebitda, excluding Hermosa, will comprise Copper 53%, 29% zinc, lead and silver and 18% manganese. In FY26 South 32 produced 87.1 kt Copper, 205.4kt Zn, 82.9kt lead and 5.1mt manganese. The $5.6bn comprises $3.1bn in cash, $1bn in Alcoa shares, $0.75 in contingent consideration and $0.75bn in net debt assumed but, in addition, Alcoa will take over $1.1bn in rehabilitation provisions. Substantial savings will be made, including in regional head office closures. While the deal includes the 30 year old Hillside aluminium refinery, as well as the idled Bayside smelter, it excluded the 63.7% owned Mozal smelter which is to go on care and maintenance following unsuccessful power supply negotiations. The wholly owned Hermosa project in southern Arizona will produce the federally designated critical minerals Zinc, lead, silver and manganese. The deal is expected to complete only in 2H27 and we expect the stock to continue rerating, as well as benefit from any increases in the copper price, until then.
African Rainbow Minerals (ARI) Financial Results FY06/26 (18353c)

HEPS: 1660c (+20% from 1379c)
EPS: 2073c (+1128% from 169c)
Operating Profit: R14.15bn (+294% from R3.59bn)
Revenue: R16.32bn (+25% from R13.03bn)
EBITDA: R16.67bn (+239% from R4.92bn)
Dividend: 700c final (total FY dividend 1200cps)
Headline earnings rose 19% to R3.2bn, driven by stronger US dollar PGM basket prices, while EPS surged due to impairment reversals and gains on disposals. Ferrous earnings fell 42% as Beeshoek Mine was placed on care and maintenance, reducing iron ore volumes. Platinum operations delivered over 200% earnings growth, supported by higher PGM prices. Net cash improved to R10.17bn, with dividends received from Harmony more than doubling to R512m. Safety performance was notable with zero fatalities, and renewable power integration commenced at PGM operations. Growth projects include Bokoni’s 180ktpm development and Nkomati’s restart as South Africa’s only primary nickel producer as well as the acquisition of 19.9% of Surge Copper which is developing the Berg project in British Columbia. The board declared a final dividend of 700cps.
Comment: while share price over a long period of time does not tell the whole story since, for example stocks like Kumba Iron Ore, whose price is not very different from what it was ten years ago, have paid substantial dividends, it certainly gives pause for thought. So, while stocks which are now largely copper oriented such as Anglo American and BHP Group have soared over the past decade despite having substantial iron ore and other interests, ARM is, although well above its mid-September 2016 low of around R90, still below its mid-January 2014 level of R195. The key question is whether its bold decision to invest about R15bn over seven years in the high-grade UG2 Bokoni brownfields development on the North-Eastern limb of the Bushveld Complex — together with the Surge Copper investment and the restart of Nkomati, South Africa’s only primary nickel mine — will put the company on a sustainable long-term growth path. Its manganese and Khumani iron ore operations should benefit from a gradual improvement in Transnet rail train availability, while, over the longer term, Khumani may also gain longer-term benefit from synergies with its neighbouring Kumba-owned Sishen Iron Ore operation. Bottom line: it is too early to tell but it will if they succeed. Meanwhile it could be held as a late entry pgms and copper beneficiary or portfolio diversifier.

FirstRand (FSR) Financial Results FY26 (9690c)

HEPS: 693.1c (+1% from 687.2c)-normalised from continuing operations
EPS: 689.8c (flat from 687.1c)-normalised from continuing operations
Revenue: NII R83.4bn (+8%), NIR R65.6bn (+12%)
Dividend: 539c (↑16% YoY; interim 259c, final 280c)
Normalised continuing earnings rose 13% to R44.5bn, with ROE at 24.9%. FNB delivered 12% earnings growth, RMB 15%, while WesBank declined 4% due to higher impairments. FirstRand plans to exit its UK operations, including Aldermore Bank and MotoNovo Finance, after regulatory uncertainty around historic motor finance commissions triggered a £518m (R11.3bn) provision. Losses from discontinued operations followed goodwill impairments and restructuring costs. FY27 guidance is for high single‑digit to low double‑digit earnings growth, CLR trending to the bottom of the TTC range, and ROE revised upwards to 21–26%. Dividend cover maintained at 1.6x, with payout ratio of 62.5%.
Comment: long story short, yet another multiyear overseas foray by a leading SA corporate is coming to an end! This time it is FNB’s activities in the UK consumer market. Nothing daunted FirstRand will be doubling down on its strategy of focusing on corporate and investment banking (CIB) in selected African markets such as Ghana, Nigeria and. recently, Zambia. This has the advantage of avoiding the hard yards of retail banking let alone the cost of establishing the bricks and mortar footprint built up over more than a century by Standard Bank and Absa (via Barclays). If anything, the severe blow inflicted by the UK Financial Conduct Authority has shown how exceptionally well the rest of FirstRand is doing as indicated by the record dividend. Moreover, while management has cautioned that the eventual penalty might exceed the provision, this could well provide a buying opportunity!

Sun International (SUI) Interim Results for 6M Jun ’26 (4700c)

HEPS: 283c (–7.2% from 305c) EPS: 300c (–2.3% from 307c)
Revenue: R6.6bn (+7.4% from R6.15bn)
EBITDA: R1.6bn (+2.0% from R1.57bn)
Dividend: 185c interim (+7.6% from 172c)
Income rose 7.4% to R6.6bn, driven by Sunbet’s 35.5% growth and casino market share gains to 49%. Adjusted EBITDA increased 2% despite inflationary cost pressures and higher capex of R492m, focused on refurbishments at Sun City, Time Square, GrandWest and Sibaya, alongside digital investment. Strong cash generation supported a 185cps interim dividend and R256m share buyback. Net debt/EBITDA remained conservative at 1.6x, with liquidity of R1.8bn. Trading in H2 has commenced strongly, with revenue growth ahead of guidance. CEO Anthony Leeming emphasised the durability of the business model and commitment to building a digitally led omnichannel gaming company.
Comment: a robust set of results from Sun International. SunBet grew well ahead of market growth in online gambling (19%) following the rollout of the new user interface. A major win this period is land based casino’s returning to growth for the first time in 3 years. There is however a risk on the horizon, Tsogo Sun’s Caledon casino license relocation was approved by the regulators (the move would put the new casino in the Somerset West region). Sun International have already taken the decision to court – whether that is on a legitimate basis, or a delay tactic to preserve the market share of GrandWest (81% of Western Cape revenue) is up for debate. Other regulatory hurdles are expected in the years ahead on the online gambling front, with sentiment around the long lasting impacts on the South African consumer being very poor. Nevertheless, following a period of heightened capex which subdued free cash flow generation and margins, on a PE of 7.2x (SSU 10.7x and TSG 5.6x); and a 3 yr average dividend yield of 10,2%; the stock can be bought for steady dividends and cyclical growth opportunities.
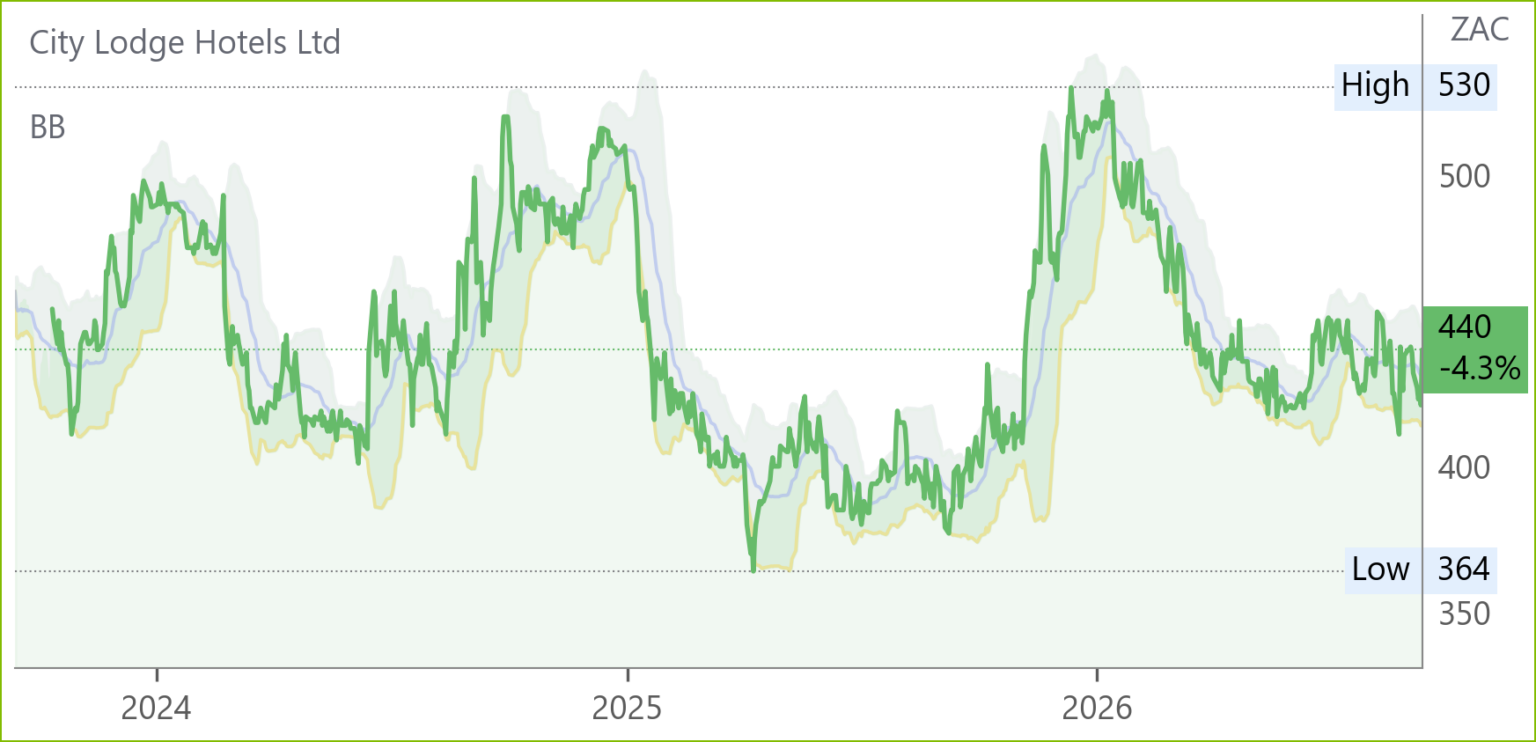
City Lodge Hotels (CLH) Financial Results FY26 (440c)
HEPS: 34.4c (+4% from 33.1c)
EPS: 38.7c (+1% from 38.3c)
Group Profit: R203m (↓5% from R213m)
Revenue: R2.2bn (+10% from R2.0bn)
EBITDA (EBITDAR): R675m (+15% from R589m)
Dividend: 19c per share (+27% YoY; final dividend 11c)
Revenue growth was supported by higher occupancy (58% vs 56%) and a 7% increase in average room rates. Food and beverage revenue rose 14% to R450m, now 20% of total revenue. Cash generated by operations increased 20% to R657m. Share buy‑backs of R153m (6.4% of shares) strengthened capital allocation. CEO Andrew Widegger emphasised refurbishments and sustainability initiatives, including solar roll‑outs and water resilience projects, to enhance competitiveness.
Refurbishments at CL Morningside and RL Gqeberha will be completed in H1FY27, with further upgrades planned. Expansion opportunities in Western Cape and KwaZulu‑Natal are being pursued, alongside a 53‑room addition at CL Waterfall City.
Comment: A modest period with flat EPS and HEPS but strong underlying operational performance and growth reflective in diluted AHEPS at +20%. Revenue growth is largely reflective of the 7% average room rate increase and 200bps tick up in group occupancy, which still remains below the 60% mark. The period saw management focus on returning capital to shareholders, with significant share buybacks of R153m, and raising the annual dividend by 27% (from 15c to 19c), ahead of all growth metrics. A stronger first half for FY 27 is expected as we shift into SA tourism season. The reconciliation between earnings and adjusted headline earnings includes a R28,7m unrealised loss on foreign exchange pertaining to an intercompany loan with CLHG Mozambique, a 360% increase from 2025, which is 13% of profit after tax this period.

Super Group (SPG) Financial Results FY26 (1780c)

HEPS: 334.6c (+36% from 246.1c)
EPS: 336.0c (+31% from 256.9c)
Operating Profit: R2.37bn (+26.6% from R1.88bn)
Revenue: R45.83bn (+6.2% from R43.17bn)
EBITDA: R4.16bn (+15.5% from R3.60bn)
Dividend: 55c final (FY25: special dividend 1630c)
Strong demand in supply chain operations and Fleet Solutions lifted earnings, with Spain’s Ader delivering a turnaround across logistics and home delivery. South African dealerships outperformed NAAMSA volumes, adding 11 new franchises, while UK dealerships exceeded national passenger market growth. Chinese brands rose to 24.9% of new vehicle sales (FY25: 15.7%). Operating profit grew 27% to R2.37bn, supported by EBITDA growth of 15.5%. The board declared a final dividend of 55cps, payable 5 Oct ’26. CEO Peter Mountford emphasised momentum and selective investment to deliver sustainable returns.
Comment: operating profit comprised 68% from SA, 14% from the UK and 11% from the rest of Africa. Supply Chain, with its South African coal and copper transport businesses, performed strongly with operating profit, which contributed 55.0% to the Group total, up 20.8% to R1.3bn. Fleet Solutions, which includes the Ader operation in Spain, contributed 18.4% to group operating profit and increased its OP by 54.3% to R441.4m. Dealerships SA increased its operating profit by 5.5% to R420.8m. TNAV is 2864c and NAV 3807c following the special dividend of 1630c from the sale of the Australian operation in mid-2065. CEO Peter Mountford, who is contracted to stay for another 4 years and answered a battery of questions from numerous analysts, commented that he thought the remaining businesses were also undervalued and so more buy backs are likely in FY27. We think he is right and the share can be bought for ongoing growth and possible corporate action.

Wilson Bayly Holmes – Ovcon (WBO) Financial Results FY26 (13695c)

HEPS: 2316c (–0.9% from 2337c)
EPS: 2295c (–2.6% from 2357c)
Operating Profit: R1.37bn (–3% from R1.42bn)
Revenue: R28.3bn (–0.6% from R28.5bn)
Dividend: 320c final (unchanged)
NAV: R6.3bn (+12.5% from R5.6bn)
Headline earnings per share slipped marginally to 2316c, with revenue down 0.6% and operating profit 3% lower at R1.37bn. Despite softer trading, the order book remained firm at R37.6bn, underpinning visibility. NAV rose 12.5% to R6.3bn, reflecting balance sheet strength. The board declared a final dividend of 320cps, unchanged from FY25. Chairman CV Henwood highlighted resilience and disciplined capital allocation.
Comment: this is a great company and the last standing of the BIG Four of the 2020’s who built World Cup stadia and other infrastructure of the day. Last year there were some hopes of an infrastructure spending pickup but that stationery order book is only just enough to keep things ticking over but not enough to warrant investment now.

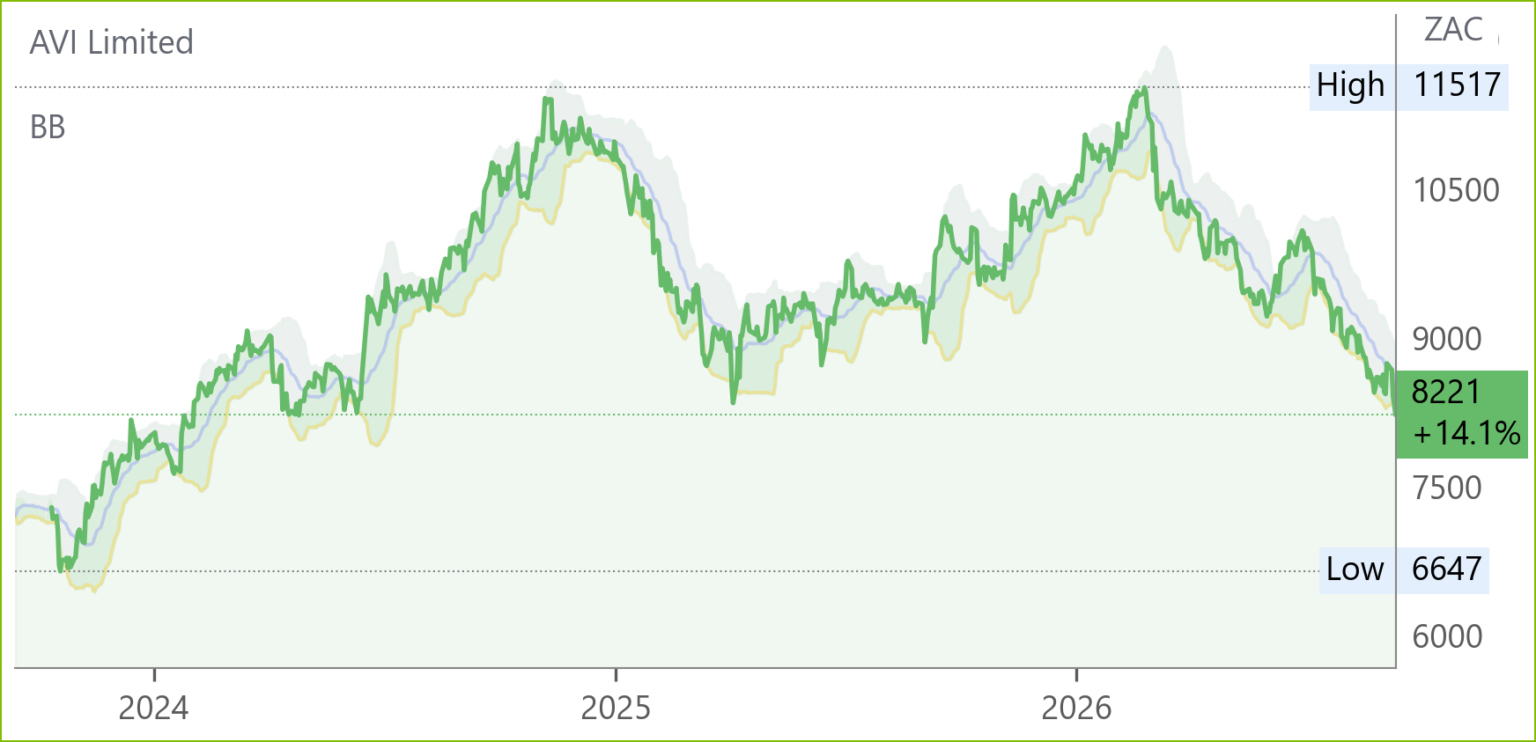
AVI (AVI) Financial Results FY26 (8221c)
HEPS: 767.9c (+5.3% from 729c)
EPS: 767.9c (+4.8% from 732c)
Operating Profit: R2.87bn (+4.4% from R2.75bn)
Revenue: R15.2bn (+1.4% from R15.0bn)
Gross Profit: R6.9bn (+0.8% from R6.85bn)
Dividend: 418c final + 300c special (total 718cps)
Resilient trading lifted operating profit 4.4% to R2.87bn, with margins improving to 22.9%. I&J’s fishing division delivered a 47.5% profit increase to R396m, offsetting weaker abalone results from an R84m biological asset revaluation. Fashion retail brands achieved 8.3% like‑for‑like growth, supported by restructuring savings of R110m. Strong cash generation reduced net debt, enabling a final dividend of 418cps and a special dividend of 300cps, equating to a 9.6% yield on the closing price. CEO Simon Crutchley emphasised portfolio resilience and capital discipline.
Comment: after peaking around R114 ahead of the Middle East crisis in late February 2026 the share price, which had previously peaked around that level in November 2024 and again way back in May 2018, took a further pasting following a 3.3% miss on consensus expectations for FY06/26. So, the question is, has the 28.3% slump in share price fully accounted for the substantial turnaround in economic prospects and marked squeeze in consumer incomes accentuated by online gambling, rising energy costs and failing municipal services? On a 10.8x PE and 8% DY (LDT 13 October and 574.4c net of dividend tax i.e. 6.9%) it is highly likely. AVI is a very unusual company with many very different products each with different characteristics and different levels of quality and margin supporting brand loyalty. CEO Simon Crutchley points out that, although AVI is a corporation it looks at each product with a different and entrepreneurial mindset. One of the strategies under consideration is the internationalisation of some brands.” Not many brands in the world today still make their crackers with milk butter and eggs.” So, if you have it, hold it. Otherwise, wait for signs of relief for the SA consumer.

Growthpoint Properties* (GRT) Financial Results FY26 (1600c)

HEPS: 119.4c (–24.9% from 159.0c)
EPS: 223.6c (+38.8% from 161.1c)
Revenue: R13.2bn (+1.3% from R13.1bn)
EBITDA: Distributable income R5.2bn (+4.4% from R5.0bn)
Dividend: 133.5c final (+7.4% from 124.3c)
LTV: 38.7% (improved from 40.1%)
NAV: 2131c/share (+3.8% from 2054c)
Distributable income per share rose 4.3% to 152.6c, supported by stronger SA operations, V&A Waterfront growth and lower finance costs. Vacancies fell to 7.2%, the lowest since FY19, while renewal success improved to 78.3%. Offshore investments delivered softer outcomes amid higher interest rates and office exposure, though GOZ occupancy rose to 96%. The V&A Waterfront distributable income grew 19% to R965m, aided by tourism recovery and residential sales. CEO Estienne de Klerk emphasised disciplined capital recycling, sustainability initiatives and portfolio repositioning, with R4.9bn of disposals executed. FY27 guidance targets 1–3% growth in DIPS and DPS, maintaining an 87.5% payout ratio.
Comment: A good set of results from Growthpoint. Positively, group LTV reduced 140bp and cost of debt down 10bps. Portfolio occupancy remains in line with the sector around 97%, although Gauteng office spaces remain a drag. Liquidity position also materially improved as group interest coverage ratio at 2.63x, well above the covenanted 1.75x. While distributable income grew at 4.3%, dividend per share outpaced, growing by 7.4%, with the payout ratio increasing 250bps to 87.5%. With a +R2bn pipeline of capex to fund, continuing deleveraging, the question remains as to the rationale for the increase. Nevertheless, the portfolio of properties remains well diversified across global regions, and at an 8.3% DY, is a reasonable inclusion in a portfolio.
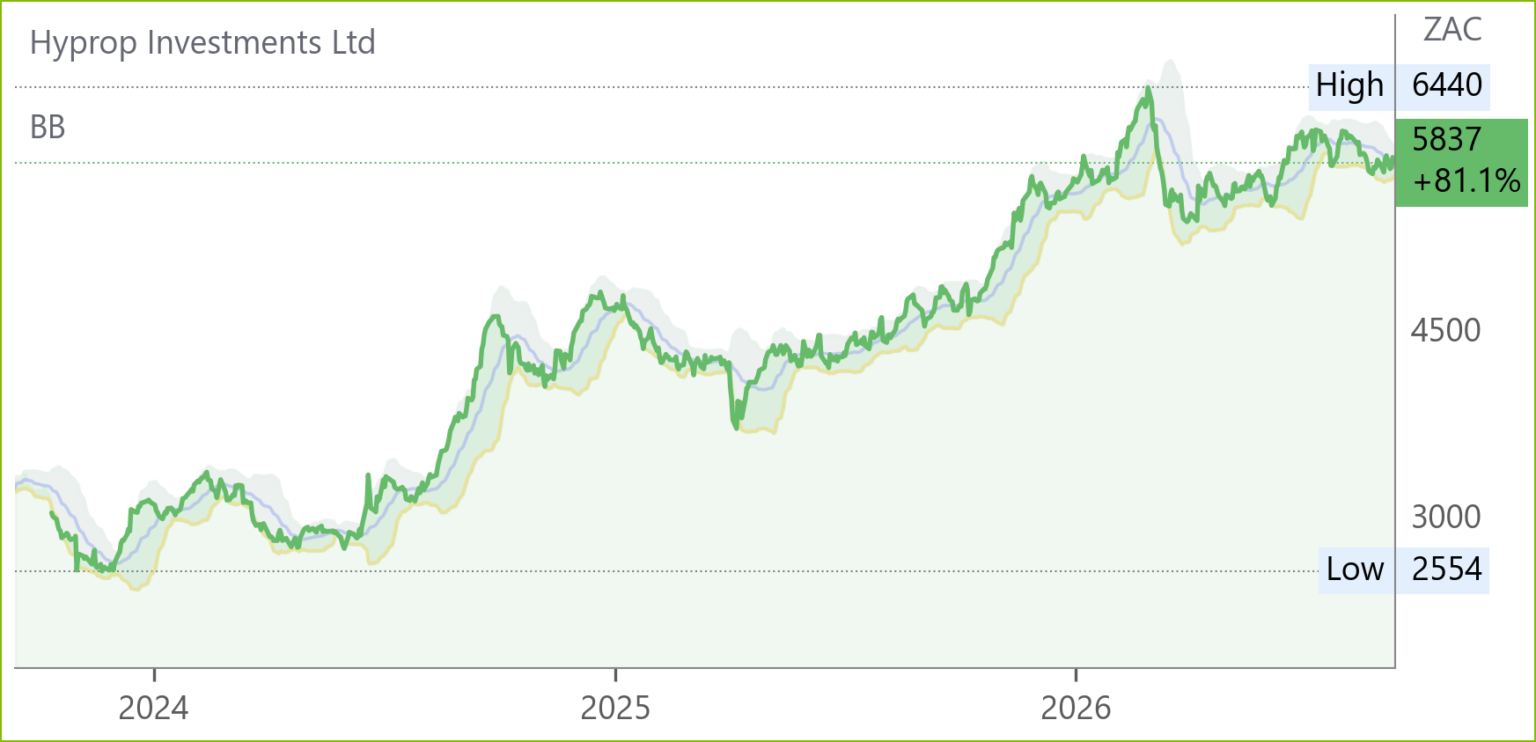
Hyprop Investments (HYP) Financial Results FY26 (5837c)
HEPS: 433.4c (+40.9% from 307.5c)
EPS: 902.9c (+58.6% from 569.3c)
Operating Profit (NOI): R1.86bn (+16.5% from R1.60bn)
EBITDA: Distributable income R1.7bn (+13.7% from R1.5bn)
Dividend: 351.9c final (+14.4% from 307.7c)
LTV: 28.5% (improved from 33.6%)
NAV: R65.62/share (+6.7% from R61.49)
Strong operational delivery lifted distributable income per share 11.7% to 423c, at the upper end of guidance. SA portfolio turnover grew 4.9% to R29.8bn, trading density rose 5.5%, and foot count averaged 7.3m per month, aided by new anchor tenants including Walmart at Clearwater Mall. Eastern Europe centres reported turnover growth of 4.2% and vacancies at just 0.1%. Capital recycling included the R825m sale of Woodlands Boulevard and the Galleria Burgas acquisition in Bulgaria. Solar‑PV capacity expanded to 22.9MW, with seven SA centres achieving net zero waste certification. CEO Morné Wilken emphasised disciplined capital management and sustainability focus. Guidance for FY27 anticipates 7–9% growth in distributable income per share.
Comment: Strong FY results, with a material strengthening of the balance sheet visible through improved group and EE LTV ratios. Completed solar projects at The Glen, Hyde Park and CapeGate will lower energy costs going forward, with further solar projects at Canal Walk and Somerset Mall still underway (expected completion Dec 2027). These are expected to add between 16 and 20 million kWh to their solar capacity, which will reduce their reliance on the grid from 86% of energy usage to around 75%, which represents a potential saving up to R61m per year. Somerset Mall phase 2 expansion has been completed, which will drive organic growth. SA spend per head growth at 3% is well behind expected YoY inflation of 4.3%for August. On a PE of 6.5x and FPE of 13.4x, market outlook is cautious at best, with average 1yr price targets forecasting a 1% fall over the next year.

Trading Statements & Updates
Pan African Resources (PAN) Trading Statement FY26 (2706c)

HEPS: 17.35–17.94 USc (↑195–205% from 5.89 USc)
EPS: 17.24–17.96 USc (↑141–151% from 7.16 USc)
Revenue: ↑ driven by higher gold price and volumes
Earnings surged on a 54.8% increase in the average gold price received (US$4,235/oz vs US$2,735/oz) and 38.3% higher gold sales (272,373oz vs 196,926oz). AISC guidance of US$1,870/oz was achieved. Exceptional costs included a US$40m increase in share‑based payment liability due to share price appreciation. Production is forecast to rise to 280,000–302,000oz in FY27, supported by Tennant Mines.
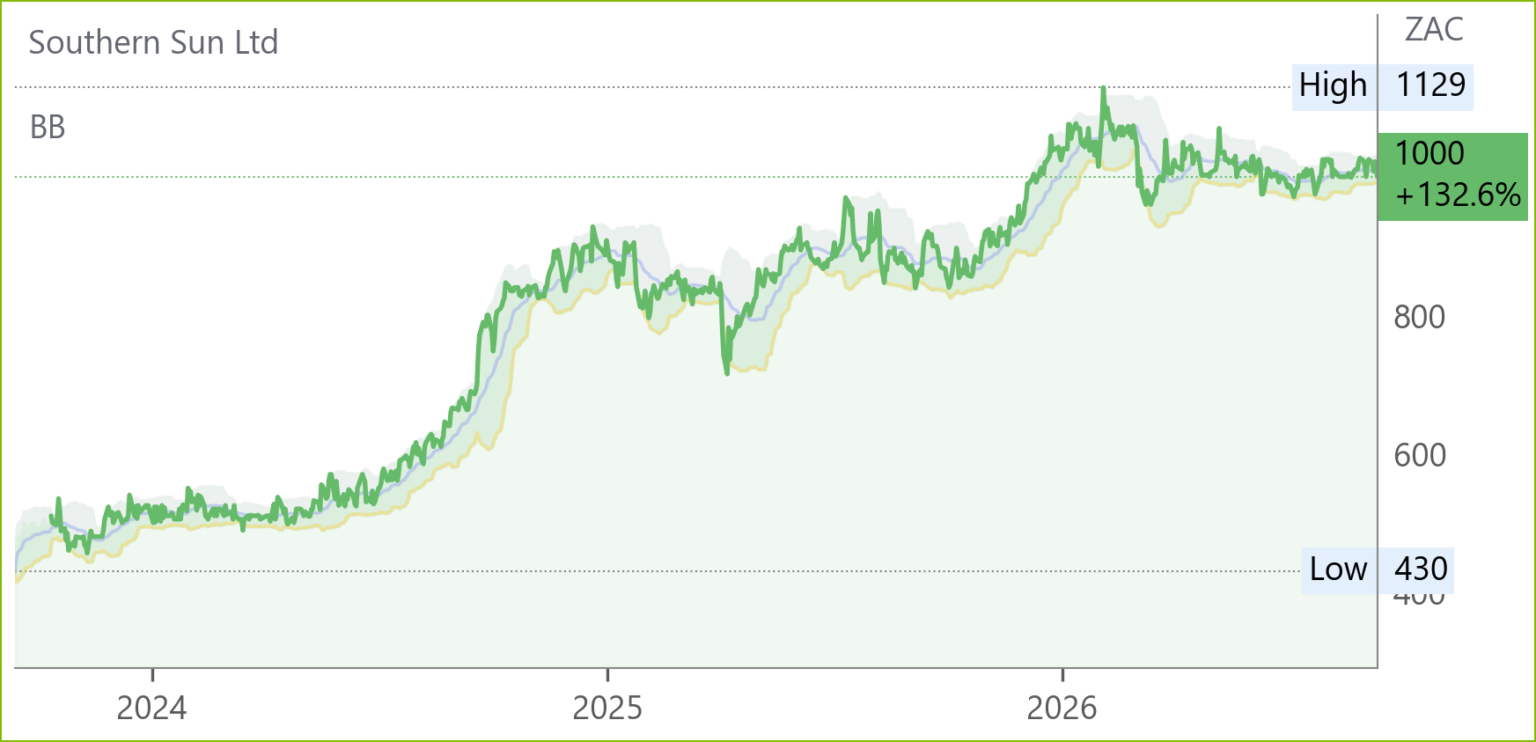
Southern Sun (SSU) Trading Statement for 6M Sep ’26 (1000c)
HEPS: ≥29.7c (+20% from 24.8c)
EPS: ≥29.4c (+20% from 24.5c)
Adjusted HEPS: ≥29.9c (+20% from 24.9c)
Revenue grew 12% in the first five months, with SA operations up 10% and offshore revenue surging 54% following the relaunch of Paradise Sun and stronger trading in Mozambique and Tanzania. Occupancy rose to 60.2% and average room rates increased 9.5%. Eventing and conferencing demand in Gauteng and Western Cape boosted Ebitda, though domestic leisure travel remained subdued. R174m of shares were repurchased and R393m final dividend paid. Several refurbishments are underway, including Southern Sun Waterfront and Hyde Park. Earnings for H1 are expected to be at least 20% higher year‑on‑year. Results due 18 Nov ’26.
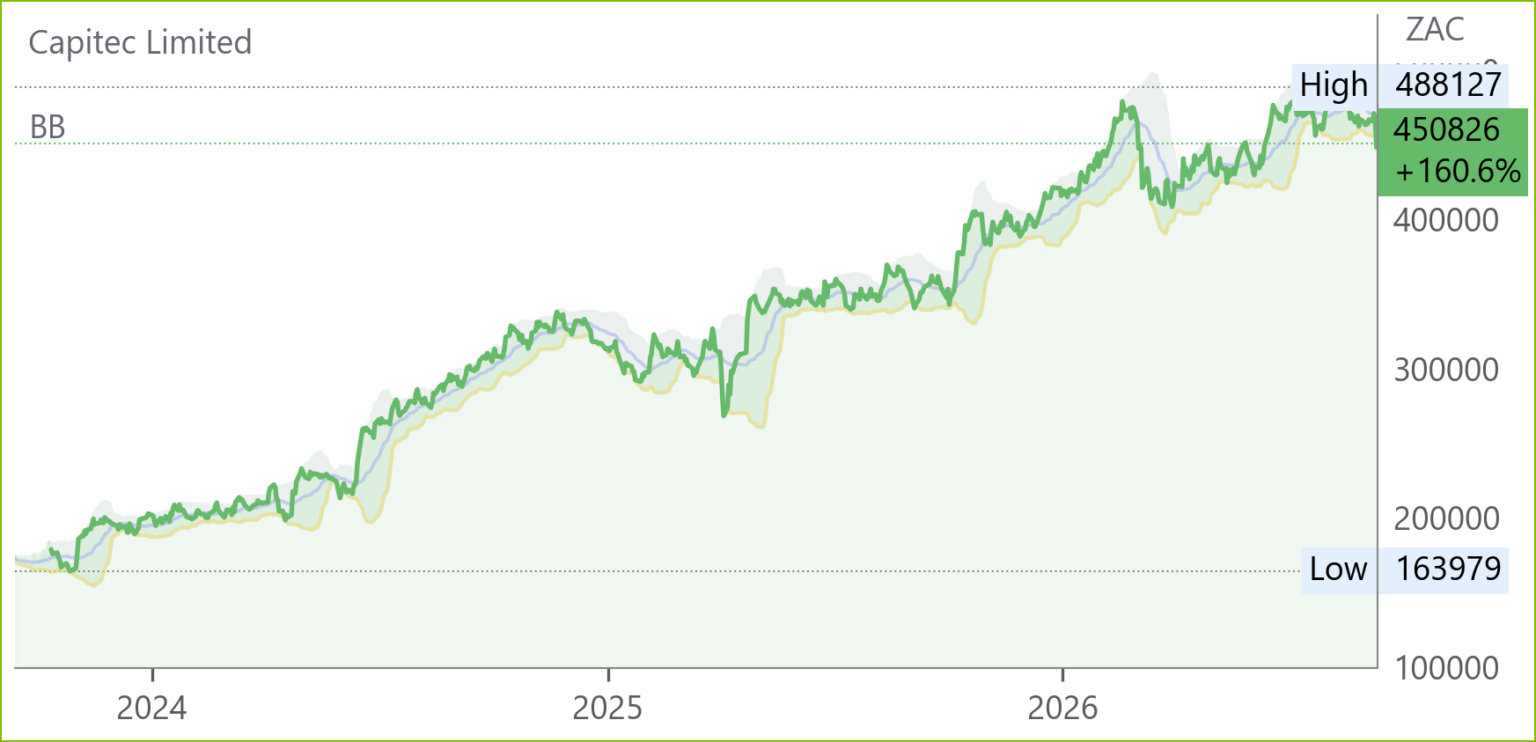
Capitec (CPI) Trading Statement for 6M Aug ’26 (450826c)
HEPS: 8215–8354c (↑18–20% from 6962c)
EPS: 8174–8312c (↑18–20% from 6927c)
Earnings growth was supported by expansion in Personal Banking (26m clients, higher transaction values, strong card usage) and Business Banking (robust lending and transactional volumes). Capitec Pay and merchant adoption continued to rise, while insurance products delivered lower claims ratios and stronger investment income. Credit impairments increased due to macroeconomic scenarios, but book quality was maintained. Technology‑driven efficiencies contained operating expenses, sustaining profitability. Results due 30 Sep ’26.
Mustek (MST) Trading Statement FY26 (1585c)

HEPS: 200.83–208.05c (↑176–186% from 72.73c)
EPS: 195.78–202.95c (↑173–183% from 71.71c)
NAV: 3000–3060c (↑5–7% from 2869.71c)
Earnings growth was driven by materially lower finance costs, favourable forex movements, disciplined cost control, and stronger equity‑accounted contributions. The trading statement was reviewed by BDO, with an unmodified assurance report issued. Mustek’s improved profitability signals operational resilience and balance sheet strength, with NAV per share rising above 3000c. Results due 20 Sep ’26.
Remgro (REM) Trading Statement FY26 (19868c)
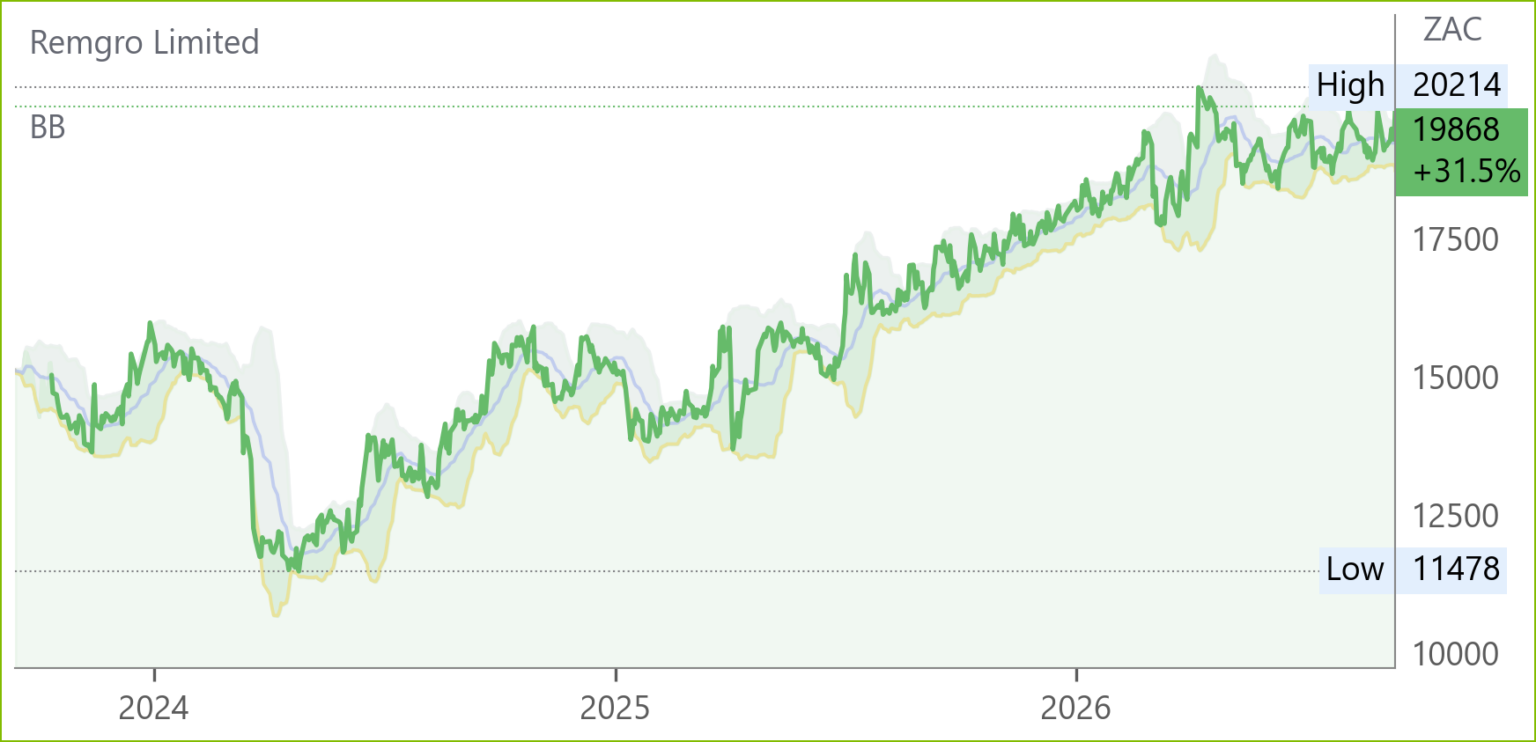
HEPS: 1930–2071c (+37–47% from 1409c)
Headline earnings are expected to rise sharply, driven by stronger operational performances across key investee companies and material once‑off items. Adjusting for these one‑offs, HEPS is anticipated to increase by 24–34%. The trading statement highlights resilience across the portfolio, with results due 21 Sep ’26.
Snippets
Exxaro (EXX) exercised its pre‑emptive right to acquire Anglo American’s 50% stake in Moranbah South, taking full ownership before agreeing to sell the entire interest to Stanmore Resources for US$105m. CEO Ben Magara said the disposal aligns with strategy to simplify the portfolio, focusing on South African coal, renewable energy and future‑facing metals. Completion is expected Q4 ’26.
Sibanye-Stillwater (SSW) has initiated Section 189A consultations on the proposed restructuring of its Kwezi shaft at Rustenburg. The mature shaft is nearing the end of its economic life, with reserve depletion accelerated by delays in the Kwezi Shallows project. Losses of R208m in 2024 and R91m in 2025 highlight sustainability concerns. About 781 employees and 333 contractors may be affected. CEO Richard Stewart said consultations aim to minimise job losses and explore alternatives, but declining reserves necessitate action. Kwezi contributed less than 3% of SA PGM output in H1 ’26.
Labat Africa (LAB) On 4 Aug ’26, Hollard instituted a liquidation application against Labat seeking winding‑up of the company, following a judgment granted in Jan ’24 awarding Hollard approximately R20m. The company has filed rescission proceedings to overturn the order, aiming to protect operations and shareholder value. Approximately 781 employees and 333 contractors could be affected if liquidation proceeds. Management stressed its commitment to resolving the dispute, maintaining compliance with JSE requirements.
Richemont (CFR) appointed Anton Rupert, son of Chairman Johann Rupert, as non‑executive co‑deputy chairman alongside Bram Schot. Effective immediately, Rupert will oversee strategic product and communications, while Schot focuses on governance.