
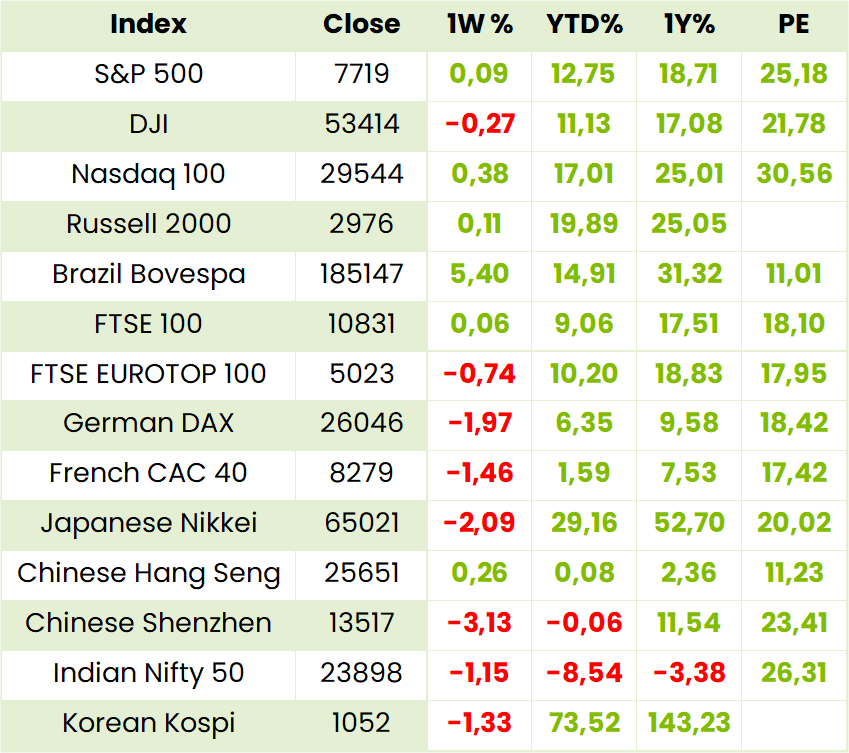
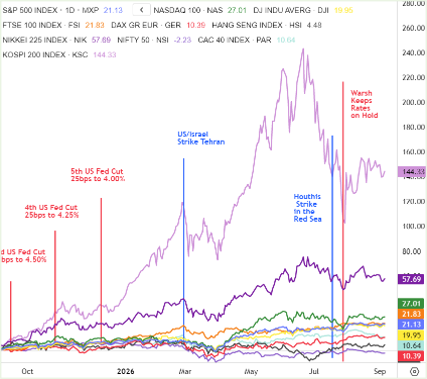
Global Indices
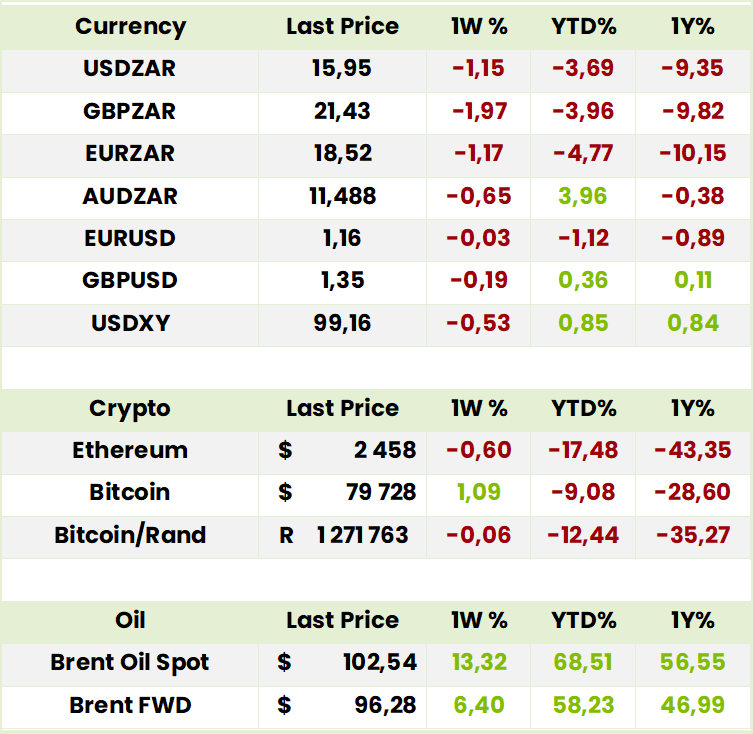
Currencies, Crypto & Commodities

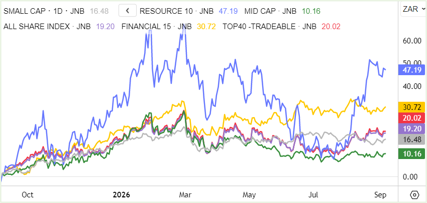
SA Indices

SA Upcoming Indicators & Dividends

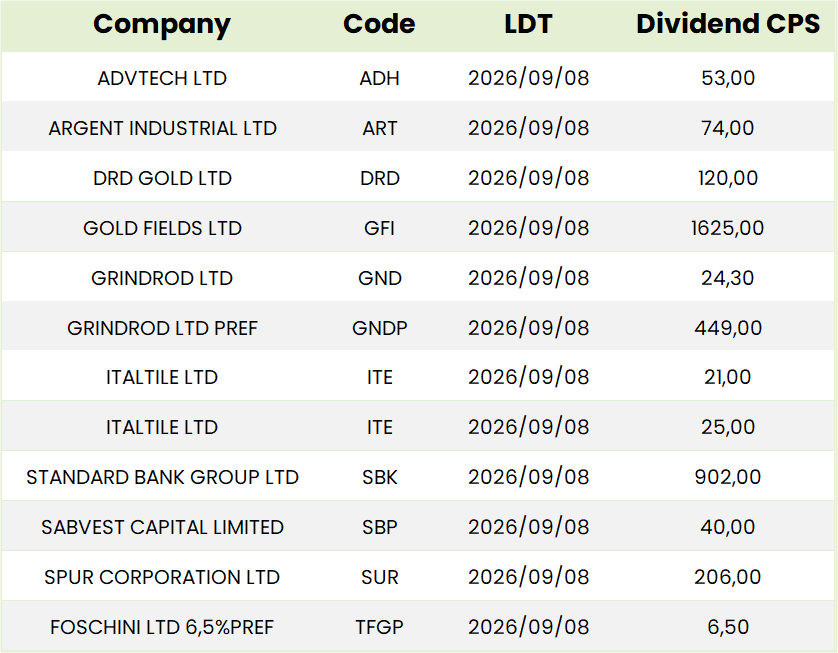

*holding in a Finova portfolio
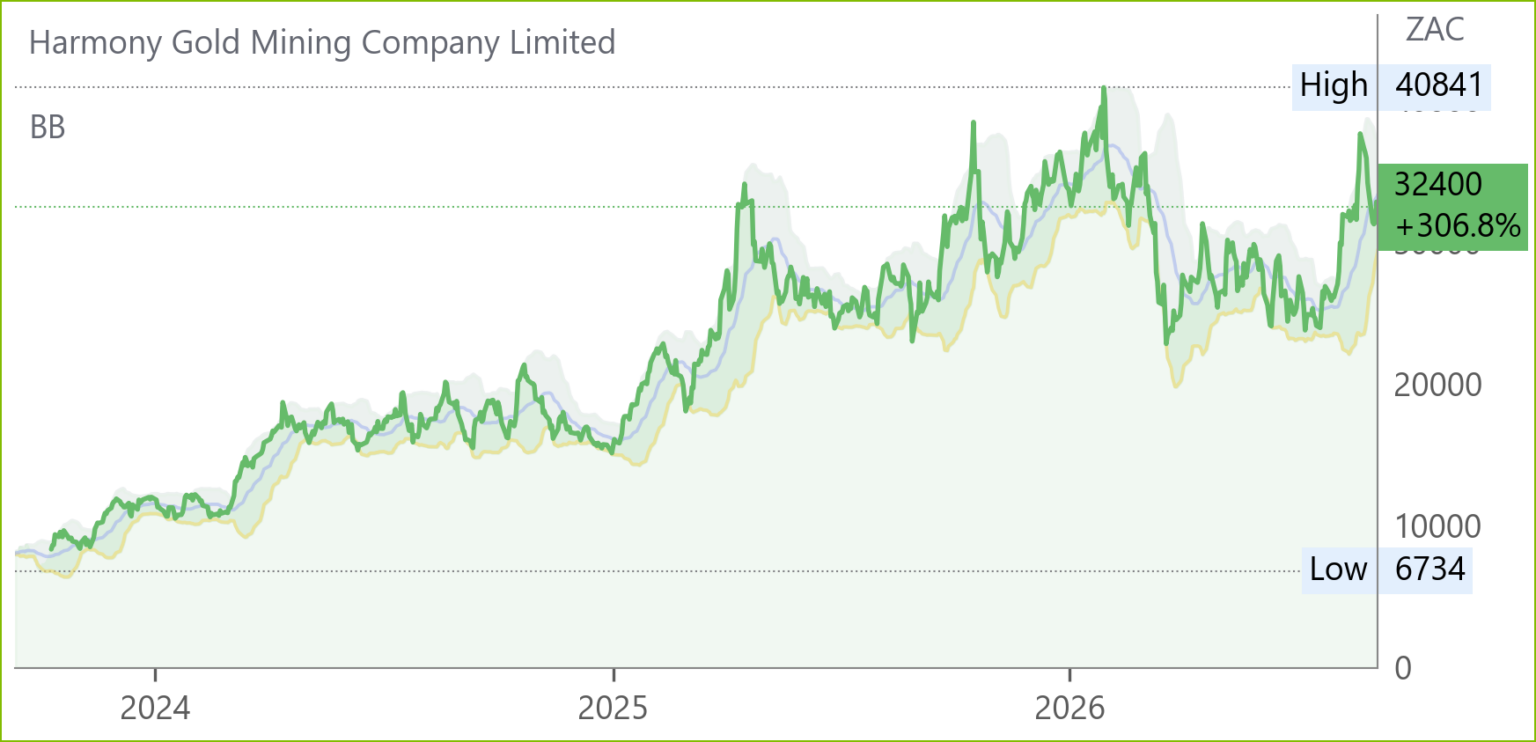
Harmony Gold* (HAR) Financial Results for FY26 (32400c)
HEPS: 4 363c (+87% from 2 337c FY25)
EPS: 4 701c (+103% from 2 313c FY25)
Operating Profit: R48.2bn (+59% from R30.2bn FY25)
Revenue: R99.2bn (+34% from R73.9bn FY25)
Gross Profit: R21.7bn (+62% from R13.4bn FY25)
EBITDA: R23.9bn (+59% from R15.0bn FY25)
Dividend: 750c per share (final; FY25: 155c)
Harmony delivered record FY26 results, with revenue up 34% to R99.2bn and operating profit rising 59% to R48.2bn, supported by higher Rand gold prices and copper output from the CSA mine. HEPS surged 87% to 4 363c, while EPS climbed 103% to 4 701c. EBITDA grew 59% to R23.9bn, reflecting strong cash generation and disciplined cost control. A final dividend of 750c per share was declared, bringing total FY26 payout to 1280c (R8.1bn). CEO Beyers Nel highlighted that FY26 marked Harmony’s evolution into a diversified gold and copper producer, achieving production guidance for the 11th consecutive year. Strategic projects advanced, including the Eva Copper development and Tshepong North life‑of‑mine extension. Outlook for FY27 guides gold production at 1.3–1.4m oz and copper output of 28–30k tonnes.
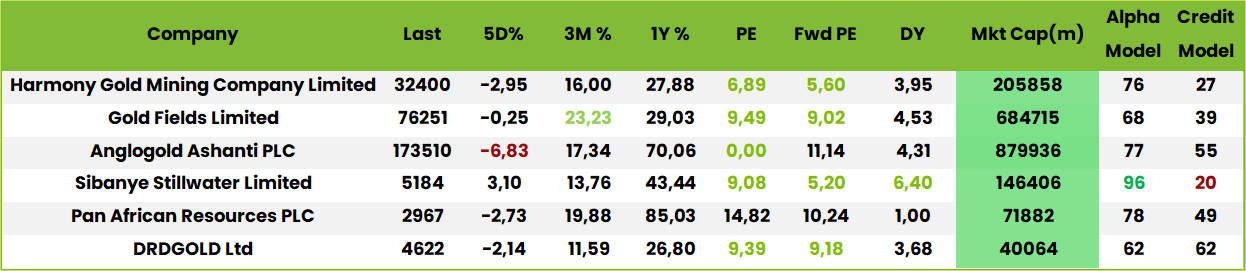
Comment: on a 7.7x PE and 3.3% DY Harmony still reflects its mainly SA gold mining status albeit modified somewhat recently by the Australian copper acquisition. As such it can be included for diversification gold portfolios espcially if, as is possible, gold share prices pull back from current levels
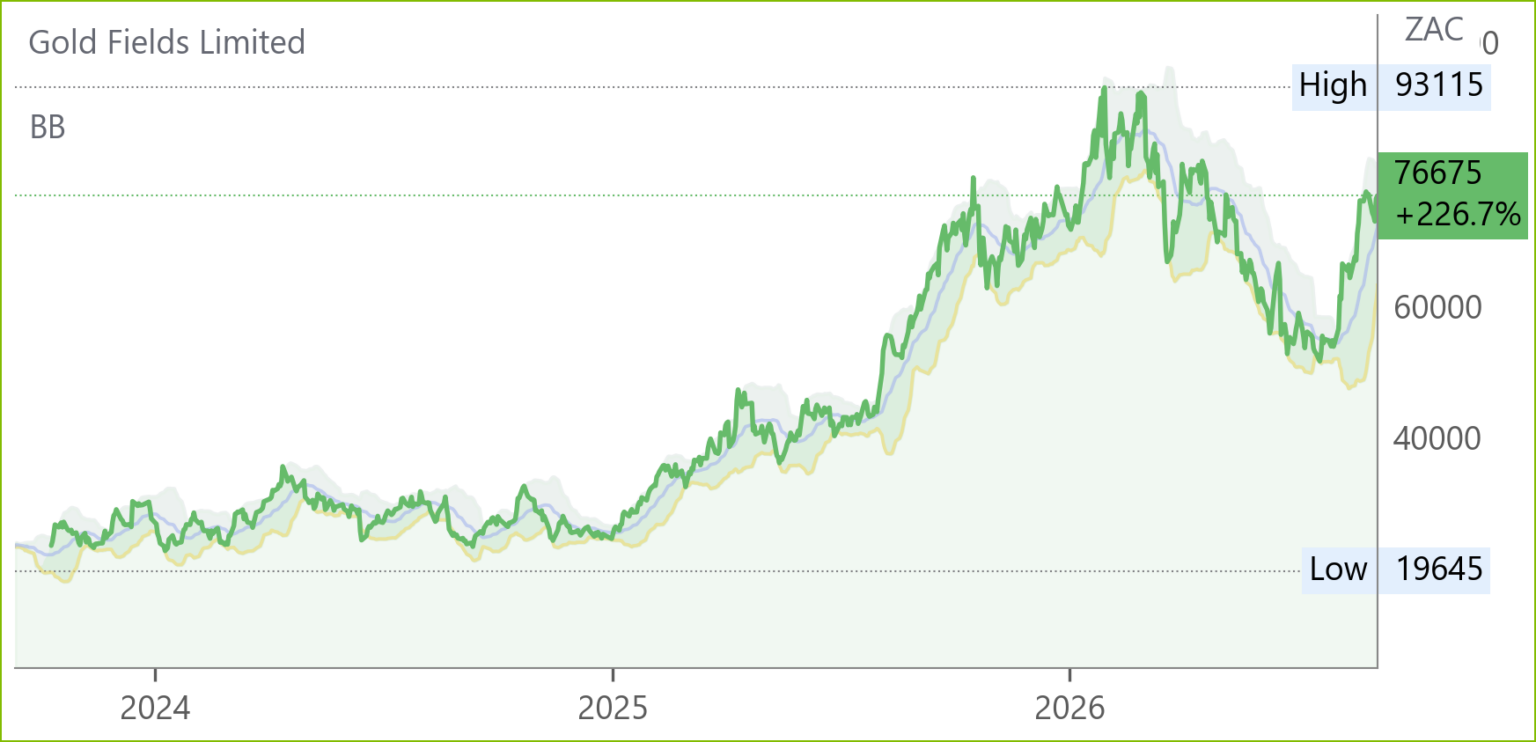
Gold Fields* (GFI) Financial Results for 6M Jun ’26 (76675c)
HEPS: 208 USc (+81% from 115 USc)
EPS: 207 USc (+80% from 115 USc)
Revenue: US$4,681/oz (+52% from US$3,089/oz)
Dividend: 1 625c per share (interim, +132% from 700c)
Net Debt: US$437m (−71% from US$1.49bn)
Free Cash Flow: US$2.23bn (+134% from US$952m)
Gold Fields delivered robust H1 ’26 results, with attributable profit rising 81% to US$1.85bn and HEPS up to 208 USc. EPS increased 80% to 207 USc, supported by 12% higher gold-equivalent production of 1.27Moz and stronger realised prices. Revenue per ounce rose 52% to US$4,681, while AISC increased to US$1,893/oz. Free cash flow surged 134% to US$2.23bn, enabling a 132% higher interim dividend of 1 625c per share. Net debt fell sharply to US$437m, reflecting disciplined capital allocation. The shareholder returns programme was expanded to US$1.25bn, including special dividends and buy-backs. Interim Company Secretary appointment was confirmed. CEO Mike Fraser stated: “We remain steadfast in our belief that fatality and serious-injury-free mining is achievable and are encouraged to report no fatalities or serious injuries in H1 2026.” Outlook remains positive, underpinned by diversified production and enhanced balance sheet strength.
Comment: Goldfields currently retains its usual rating among th Big Three of JSE listed gold miners i.e between Harmony and Anglogold. Its South Deep mine contibutes 12% to gold production with the major contribution being fom Australia at 44%, followed by Ghana at 21%, Chile at 16% and Peru at 7%. There is, however, some uncertainty as regards Ghana which refused to renew the smaller Damang lease and has indicated that there will be no automatic renewal of the larger Tarkwa (2025 production 425koz) lease on expiry in April 2027 and advance renewal talks have been suspended. Local media and other entities are also calling fo non-renewal because of the anti-migrant protests in SA. Developing country mining jurisdictions often call for windfall taxes in boom times so what may well happen is that the Ghanaian government ends up raising royalty payments by, say, 5%. Be that as it may, the possibility, however remote, indicates that inveetor should consider diversification in their gold portfolios as much as others.
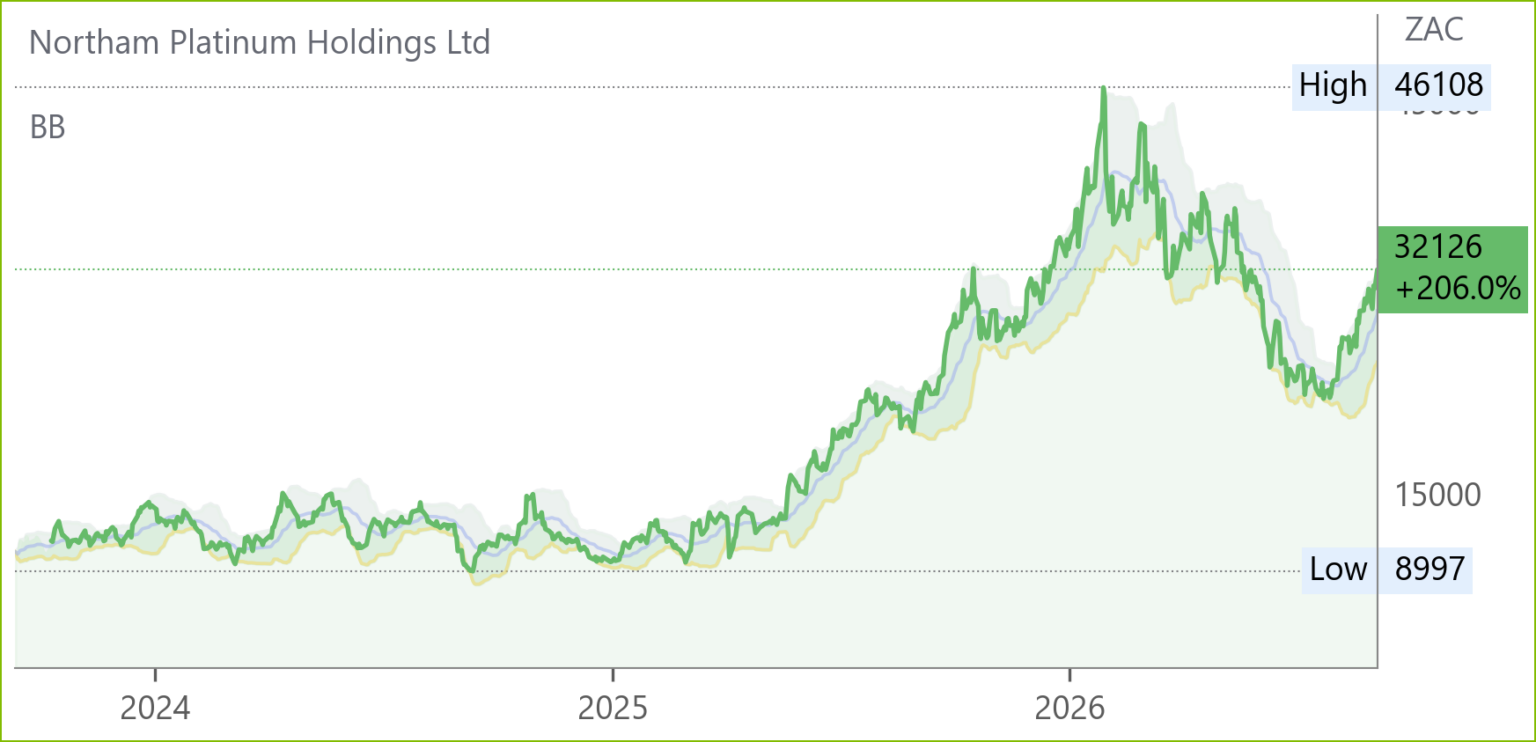
Northam Platinum* (NPH) Financial Results FY26 (32126c)
HEPS: 3 044.2c (+699.4% from 380.8c)
EPS: 3 526.1c (+824.5% from 381.4c)
Operating Profit: R14.15bn (+293.8% from R3.59bn)
Revenue: R53.99bn (+64.1% from R32.90bn)
EBITDA: R16.67bn (+239.1% from R4.92bn)
Dividend: 1 700cps (700c interim + 1 000c final)
Record results reflect strong operational performance and higher realised PGM basket prices, with EBITDA margins expanding to 30.9%. HEPS and EPS surged more than seven‑fold, supported by improved production volumes and cost discipline. The board declared a total dividend of 1 700cps, equating to R6.8bn and 56.7% of headline earnings, underscoring balance sheet strength. Operating margin rose to 26.2% from 10.9%, highlighting efficiency gains. Management emphasised continued reserve growth and strategic capital allocation to sustain long‑term shareholder value.
Comment: not so long ago Northam was gunning for 1moz pgm production and now, just as an undisclosed party has expressed an interest in some kind for transaction which could be either for an asset or the entire business, CEO Paul Dunne has announced the 2031 target of 1.5moz and 2mt chrome. So, either way, the stock has substantial growth potential whether on its own or after a deal with the in the media widely mooted Valterra. Less likely is the commodities trader cum miner Glencore, which has superb knowledge of resources value, or an out of the bue suitor (ex China!?). Either way the stock can be bought for portfolios underweight PGMs.
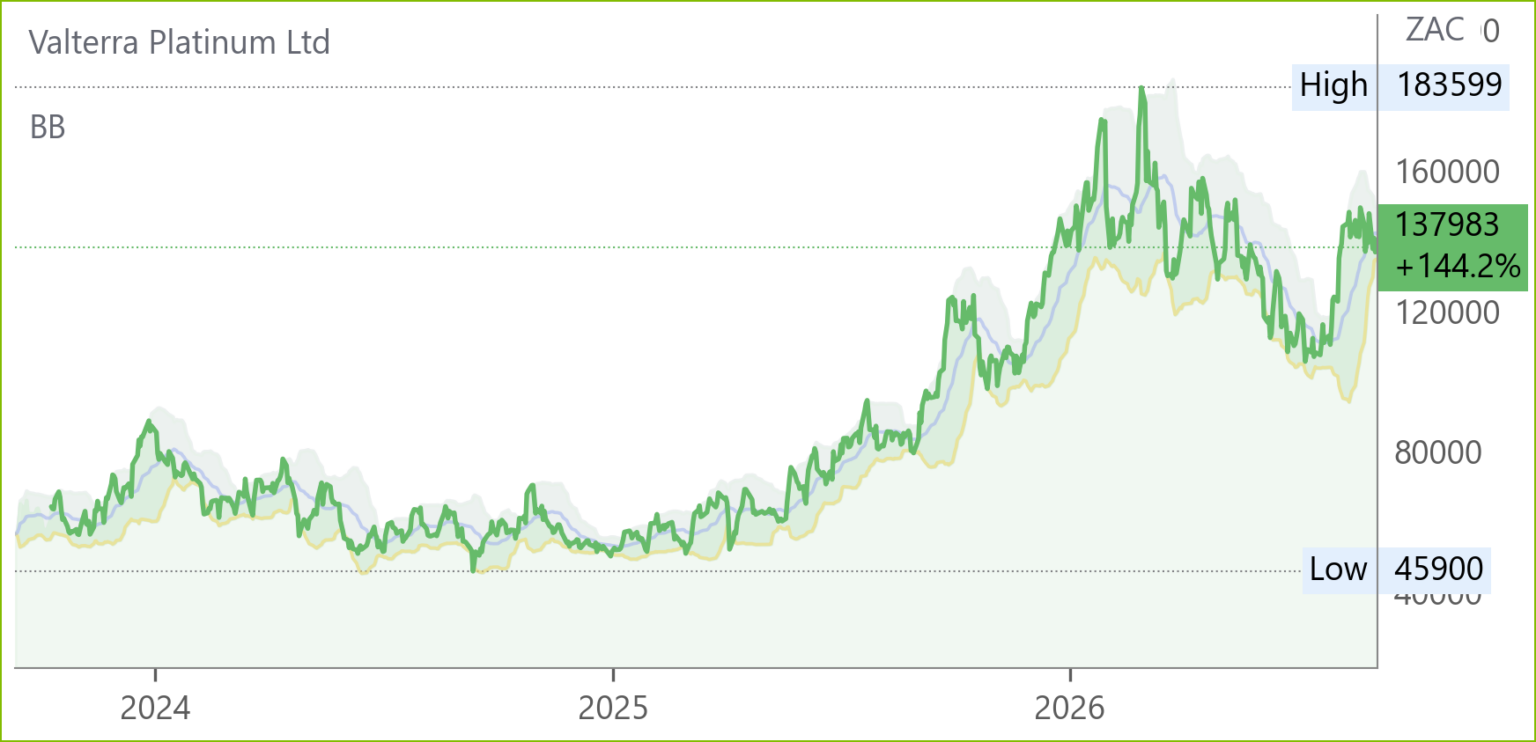
Valterra Platinum (VAL) Interim Results for 6M Jun ’26 (137983c)
HEPS: 8202c (↑1,634% from 473c)
EPS: 8231c (↑3,591% from 223c)
Operating Profit: R21.6bn (↑3,500% from R0.6bn)
Revenue: R81.8bn (↑93% from R42.3bn)
EBITDA: R33.4bn (↑406% from R6.6bn)
Dividend: 5700c interim (↑2,750% from 200c)
PGM production rose 4% to 1.52Moz, refined output surged 25% to 1.74Moz, and sales volumes climbed 18% to 1.74Moz. Realised basket prices increased 85% in US$ terms and 66% in rand, driving EBITDA up four-fold to R33.4bn and headline earnings to R21.5bn. Free cash flow of R25.5bn strengthened the balance sheet to a net cash position of R23.7bn. Operational highlights included improved chrome yields at Amandelbult (+18%) and concentrator recoveries at Mogalakwena (+15%). CEO Craig Miller stated: “Our exceptional first-half performance reflects strong operational momentum, disciplined execution and industry-leading shareholder returns.” An interim dividend of R57/share (70% payout ratio) was declared. Safety remained a concern with three fatalities, prompting enhanced risk management and leadership accountability. Guidance for FY26 production of 3.0–3.4Moz and unit costs of R19,000–R20,000/oz remains intact.
Comment: having fallen 43% since the closure of Hormuz at the end of February the share price recovered 33% following the 14 July trading statement. The above mentioned operational improvements are indeed meaningful while renewable energy and other measures will help counter inflationary impacts resulting from the Middle East War. Underlying the share price collapse in March, was the concern that the move to EVs and net zero objectives, which were abating somewhat in the West, would resume given the increased risks and cost of oil. These concerns are well grounded but, on a FPE of 10.8x and FDY of 5.8%, they are well discounted especially given the favourable production outlook., and AISC below $1000/oz. For many other reasons, Valterra remains the Rolls Royce of the sector. Pgm prices are likely to remain high while the Straits remain closed and thereafter if the move towards hybrids instead of EVs, gain momentum.
Impala Platinum (IMP) Financial Results FY26 (24202c)

HEPS: 2 548c (>100% from 82c)
EPS: 3 459c (>100% from 85c)
Operating Profit: R31.7bn (>100% from R707m)
Revenue: R135.1bn (+58% from R85.5bn)
Gross Profit: R33.1bn (>100% from R2.4bn)
EBITDA: R43.6bn (>100% from R9.9bn)
Dividend: 1 855cps (490c final + 955c additional + 410c interim)
Implats delivered record FY26 results, with revenue up 58% to R135.1bn and EBITDA surging to R43.6bn at a 32% margin. HEPS rose to 2 548cps and EPS to 3 459cps, aided by R11.1bn impairment reversals at Rustenburg. Free cash flow reached R22bn, of which 82% was returned to shareholders via dividends totalling 1 855cps. Refined 6E output increased 5% to 3.56Moz, supported by strong South African processing assets. Mineral reserves grew 9% to 53.8Moz, underpinned by life‑of‑mine extensions. Capital expenditure rose 3% to R7.2bn, focused on energy security and sustainability. Outlook guidance for FY27 is 3.3–3.5Moz refined output, with unit costs expected to rise 4–8%. Management emphasised strategic flexibility and resilience in tight PGM markets.
Comment: Nico Muller was particularly pleased with operational improvements in numerous areas and, in support of his pgm prices optimism, suggested that, since pgms were clearly on the critical metals list, western consumers could well build up stockpiles over the next three years.
He didn’t say it but this might extend to governments who witnessed the massive benefit China gained from its much higher than expected stockpiles of crude when the Straits were closed. To a lesser extent the US also benefitted, wisely or not, by running its Strategic Petroleum Reserve down from level of over 600 million barrels to around 260mb. In answer to a question about consolidation in the industry, he said there was always room for this as it would lead to lower costs of production. The stock is appropriately rated for the quality of its assets and will allow investors to benefit from pgms at a generous starting yield.
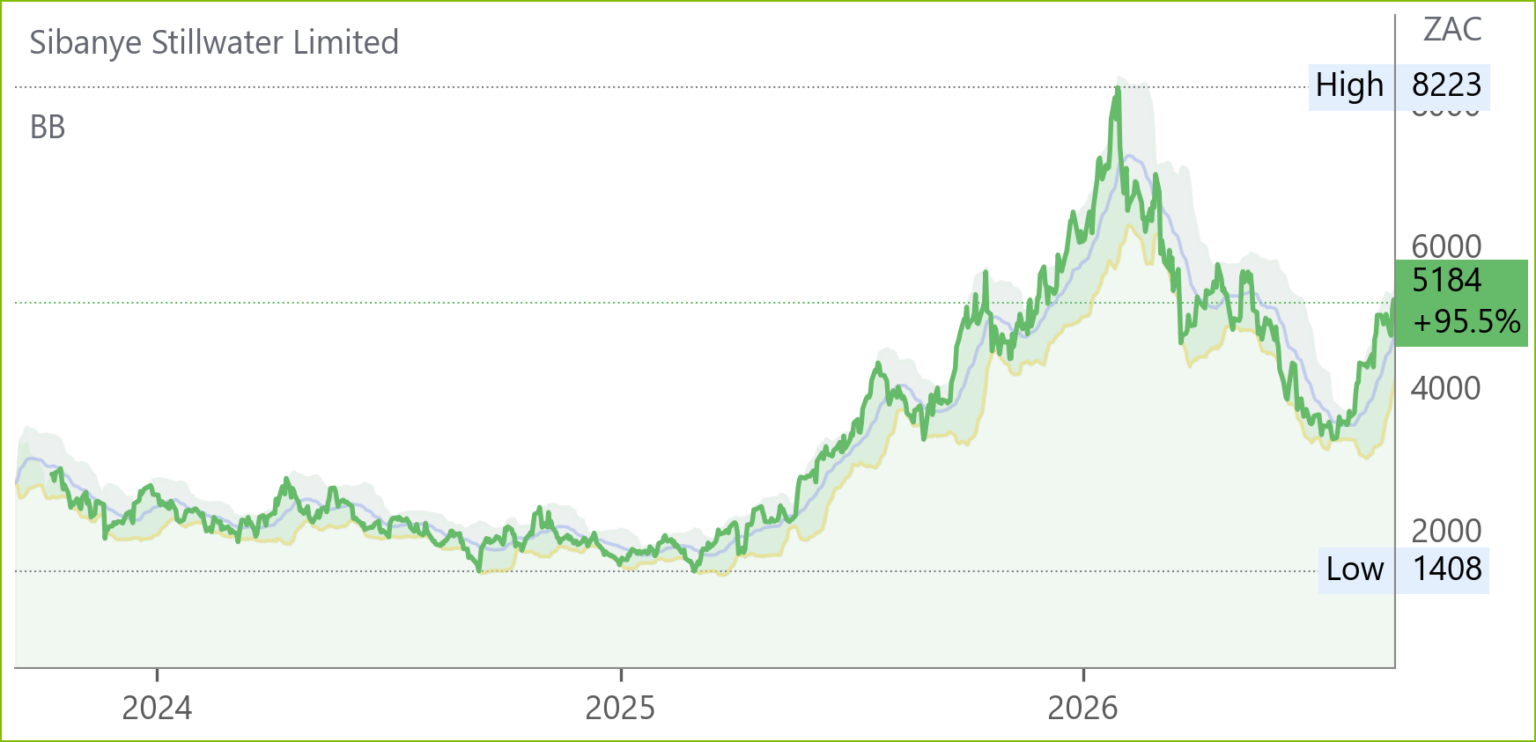
Sibanye Stillwater* (SSW) Interim Results for 6M Jun ’26 (5184c)
HEPS: 601c (+216% from 190c)
EPS: 627c (profit vs -127c loss)
Operating Profit: R18.8bn (vs R3.9bn loss)
Revenue: R89.98bn (+64% from R54.77bn)
EBITDA: R31.8bn (+111% from R15.1bn)
Dividend: 201c interim (R5.7bn declared)
Revenue surged 64% to R90bn, supported by stronger commodity prices and stable operations. Adjusted EBITDA more than doubled to R31.8bn, while net profit rebounded to R18.8bn from a prior loss. Free cash flow of R14.5bn enabled debt reduction, with gross debt down 20% and net debt halved to R9.7bn, improving gearing to 0.18x. SA PGM operations delivered a 44% AISC margin, and SA gold achieved record EBITDA of R9bn despite inflationary cost pressures. Recycling volumes rose 142%, materially boosting earnings. CEO Richard Stewart stated: “This result demonstrates the value and earnings potential of our unique portfolio, while materially advancing our strategic objective of strengthening business fundamentals.”
Comment: the bulk of the R70.6bn adjusted Ebitda was from SA pgms at R57.4bn with gold at R9bn while International contributed R4.2bn. SA pgms production was 1.7moz, USA 290koz from mining and 195koz from recycling. US operations included a further 2.6moz recycling of other precious metals and a zinc end of life operation. In addition there is the restarting Mt Lyell copper mine in Tasmania, the Century zinc project in Queensland and the Keliber Lithium mine in Finland. Although these projects do not as yet move the needle they illustrate that Sibanye Stillwater can and does deploy mining expertise gobally and is likely find more opportunities. So, as it lacks the quality and spectacular size of the likes of Valterra and Anglogold Ashanti it is priced accordingly and can safey be considered whenever buying opportunities present themselves.

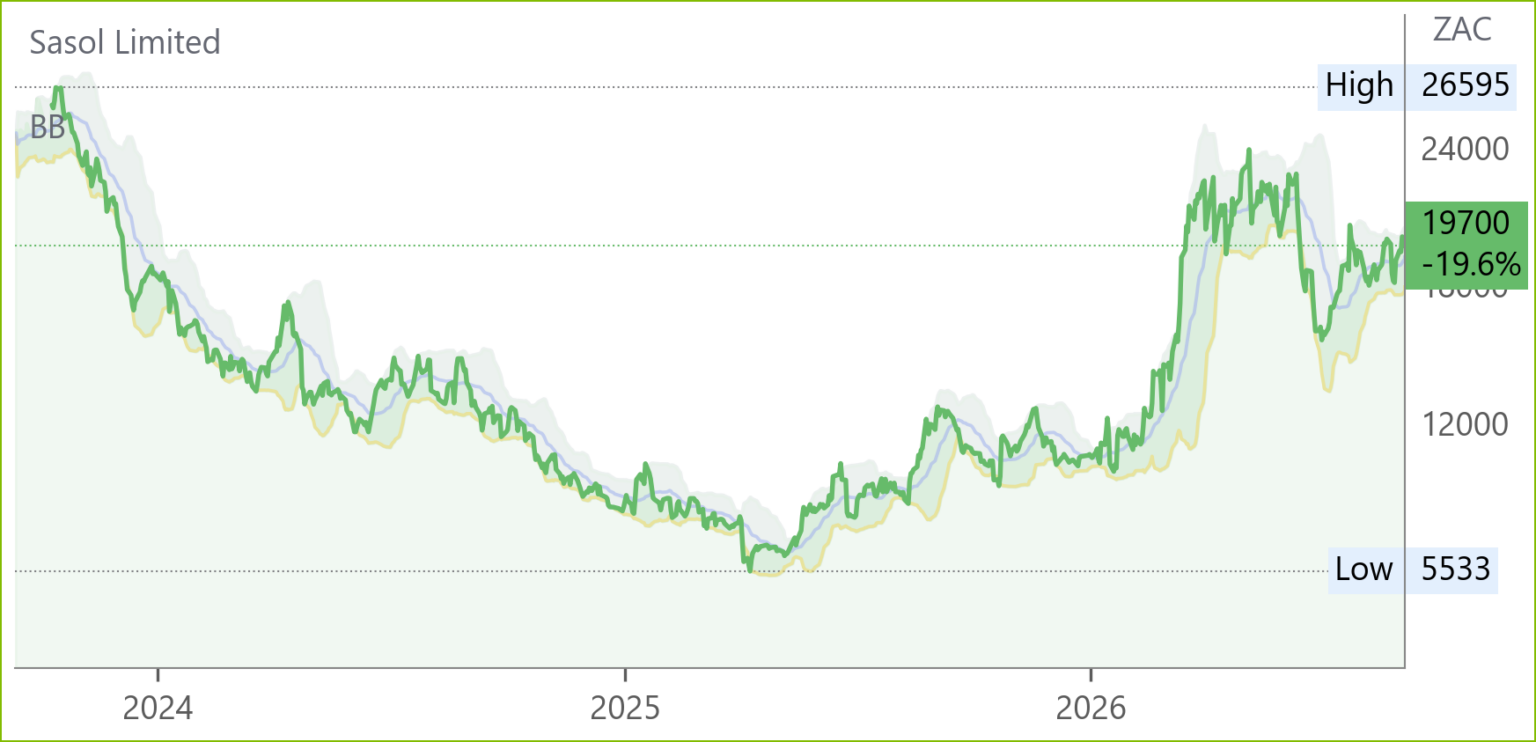
Sasol (SOL) Financial Results FY26 (19700c)
HEPS: 3831c (+9% from 3513c)
EPS: 1899c (+79% from 1060c)
Operating Profit: R25.7bn (+37% from R18.8bn)
Revenue: R272.1bn (+9% from R249.1bn)
EBITDA: R61bn (+17% from R51.8bn)
Dividend: Nil (policy requires net debt <US$3bn; current US$3.3bn)
Sales volumes rose 4% and Brent crude averaged 7% higher, while refining margins more than doubled, driving stronger earnings. Cost discipline held fixed costs flat at R70bn for a third year. Free cash flow fell 5% to R11.9bn due to elevated working capital, though excluding the prior year’s Transnet settlement, FCF improved 26%. Net debt reduced 11% to US$3.3bn, extending maturities and maintaining US$5bn liquidity. CEO Simon Baloyi noted: “2026 was a decisive year of delivery… we strengthened the foundation business, built resilience and created a stronger platform for future growth and transformation.”
Comment: Sasol’s FY26 results were operationally strong, with EBITDA ahead of expectations, robust free cash flow, and ongoing balance sheet repair. Lower FY27 capex guidance supports near‑term cash generation, reflecting improved execution under management. However, while the market rewards the operational recovery and commodity tailwinds, structural earnings headwinds beyond FY28 remain underappreciated. Near‑term momentum is encouraging, but the longer‑term investment thesis is challenged, leaving Sasol exposed once the current cycle fades. So, for example, whereas adjusted ebitda comprises Fuels 58% and Chemicals 16% they each comprise some 38% of fixed assets. Chemicals suffers from perennial overproduction and, while Fuels currently benefits from high oil prices and so is strong now, the sustainability of earnings beyond FY28 is questionable. Despite being partially discounted on a 5.3x PE there are more compelling commodity investments elsewhere.

Aspen Pharmacare* (APN) Financial Results for FY26 (15043c)
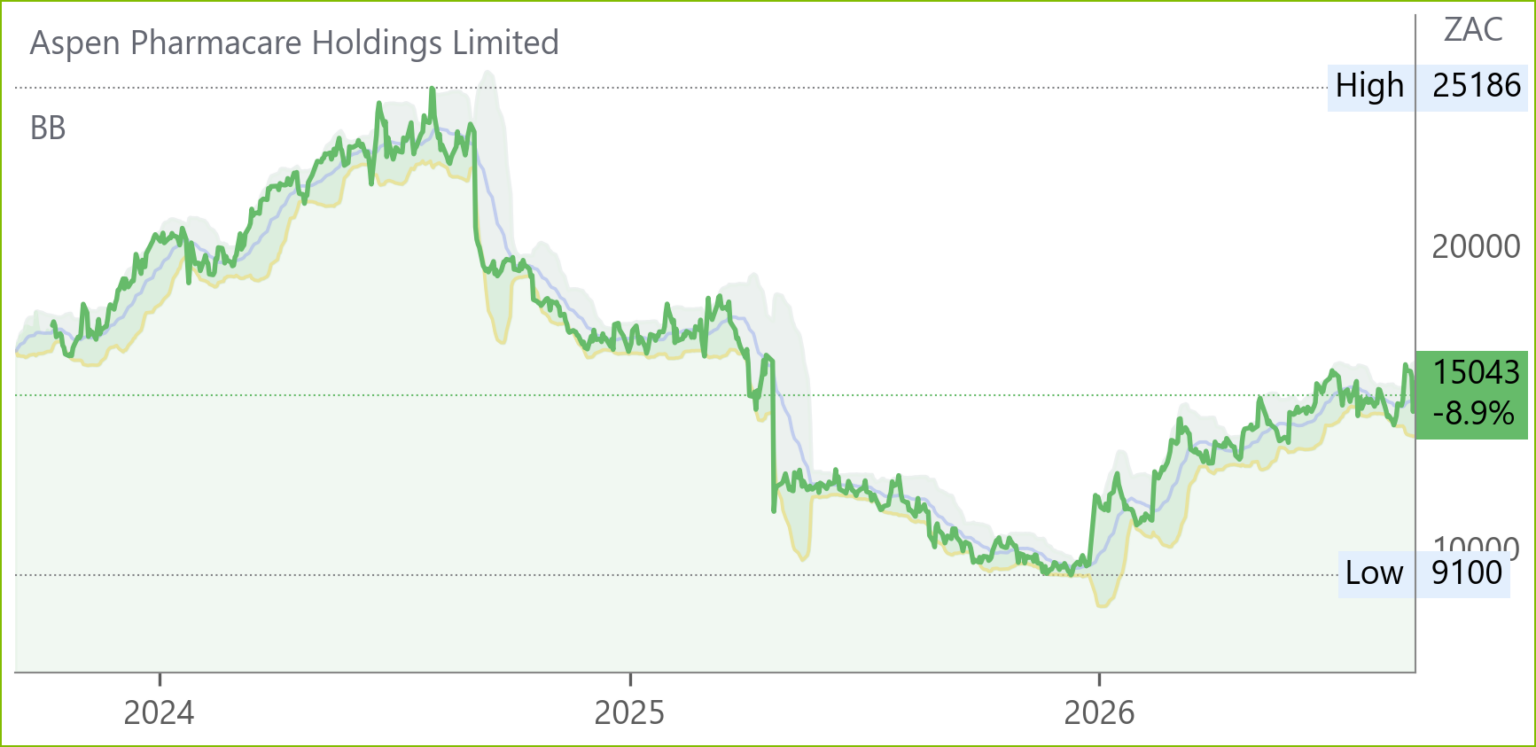
HEPS: 630.0cps (−20% from 792.1c)
EPS: 596.0cps (>100% from −243.9c)
Operating Profit: R763m (>100% from −R790m)
Revenue: R34.9bn (flat YoY)
Gross Profit: R14.1bn (−3% from R14.8bn)
EBITDA: R7.7bn (+10% from R7.0bn)
Dividend: 232cps (+10% from 211cps)
Aspen delivered resilient FY26 results, with Commercial Pharmaceuticals revenue up 5% and EBITDA growth of 13%. Manufacturing EBITDA rose 21% despite the absence of the prior year’s mRNA contract, supported by sterile FDF facility upgrades in France and South Africa. EPS swung to 596c from a loss, aided by a R2.4bn gain on the APAC divestment, while HEPS fell 20% due to R2.3bn restructuring costs and intangible impairments. Free cash flow reached R3.8bn, with net cash of R0.8bn after R0.5bn in buybacks. Regulatory approval was secured for generic semaglutide in Canada, and insulin production commenced in May ’26. CEO Stephen Saad emphasised that restructuring projects are “fundamental to our future success, already yielding sustainable benefits.” Outlook targets EBITDA ≥R9bn in FY27, driven by sterile FDF and GLP‑1 portfolio rollout.
Comment: Aspen’s FY26 results highlight a strong operational recovery, with normalised EBITDA up 14% driven by Commercial Pharma (+13%) and Manufacturing (+21%). Robust free cash flow and the APAC divestment placed Aspen in a net‑cash position for the first time, enhancing balance sheet flexibility. Regulatory approvals in Canada and South Africa support growth in GLP‑1 and insulin markets, while Mounjaro exceeded R1bn in sales locally. Despite R2.3bn impairments from higher discount rates, Aspen retains 45% valuation headroom on intangibles, underscoring resilience and strategic positioning for FY27 and beyond*.

Shoprite (SHP) Financial Results for 52W Jun ’26 (31518c)
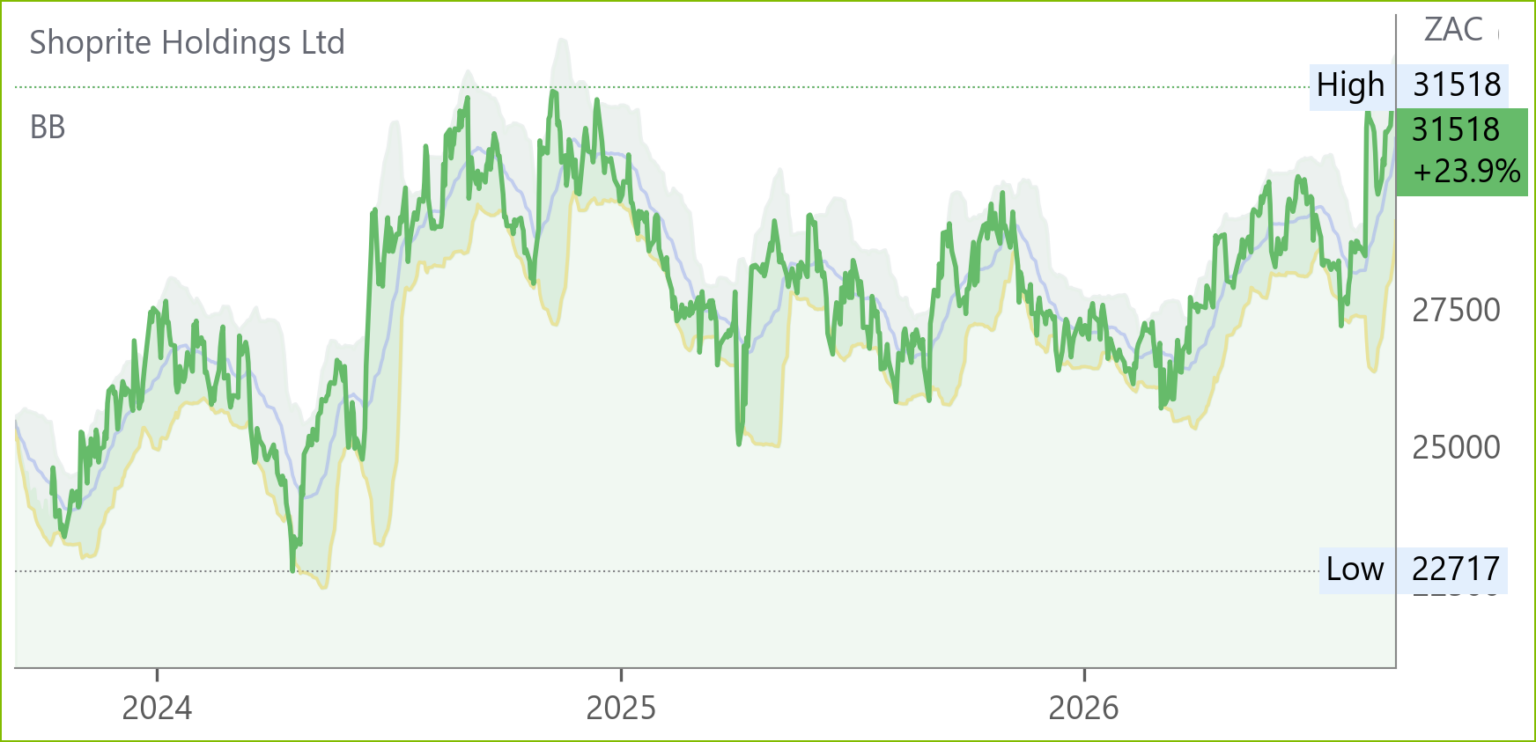
HEPS: 1 532.5c (+12.2% from 1 365.9c)
EPS: 1 498.9c (+7.2% from 1 398.4c)
Operating Profit: R15.97bn (+5.7% from R15.11bn)
Revenue: R270.8bn (+7.2% from R252.7bn)
Dividend: 873c (final 566c, +11.8% from 781c)
Group sales rose 7.2% to R270.8bn, with Supermarkets RSA contributing 84.5% of revenue and Checkers delivering 10% growth. Digital platform Sixty60 surged 34.5% to R25.5bn, while Petshop Science expanded 74.5% to 185 stores. Non‑RSA operations grew 11%, improving profitability. CEO Pieter Engelbrecht emphasised affordability, noting internal food inflation of 0.8% versus Stats SA’s 3.9%, and highlighted acquisitions of R&A Cellular and Vida e Caffè to diversify into financial services and quick‑service retail: “Our selling price inflation reflects the Group’s continued commitment to lowest prices and affordability.”
Comment: Shoprite delivered a strong FY26 print, with HEPS in line at the guided mid‑point and post‑period sales showing improvement despite soft food inflation. Management expects a turnaround, underpinned by resilient execution. ROIC continues to trend higher even with a materially expanded capital base, underscoring operational discipline. While much of the good news is arguably priced in, Shoprite remains a best‑of‑breed SA retailer, and fading such names carries risk given consistent delivery, improving returns, and management’s confidence in the outlook. CEO Pieter Engelbrecht highlighted 1.1m additional weekly customers served in a deflationary environment, underscoring the success of the “everyday store” strategy. Sixty60 surged past R25bn in sales, exceeding the combined market caps of Pick n Pay and Spar, while Petshop Science grew 75%. Strategic acquisitions of R&A Cellular and Vida e Caffè broaden consumer spend capture. Margin expansion and disciplined cost control reinforce Shoprite’s positioning as SA’s leading retailer with strong growth and ROIC delivery.
Woolworths (WHL) Financial Results for FY26 (4219c)
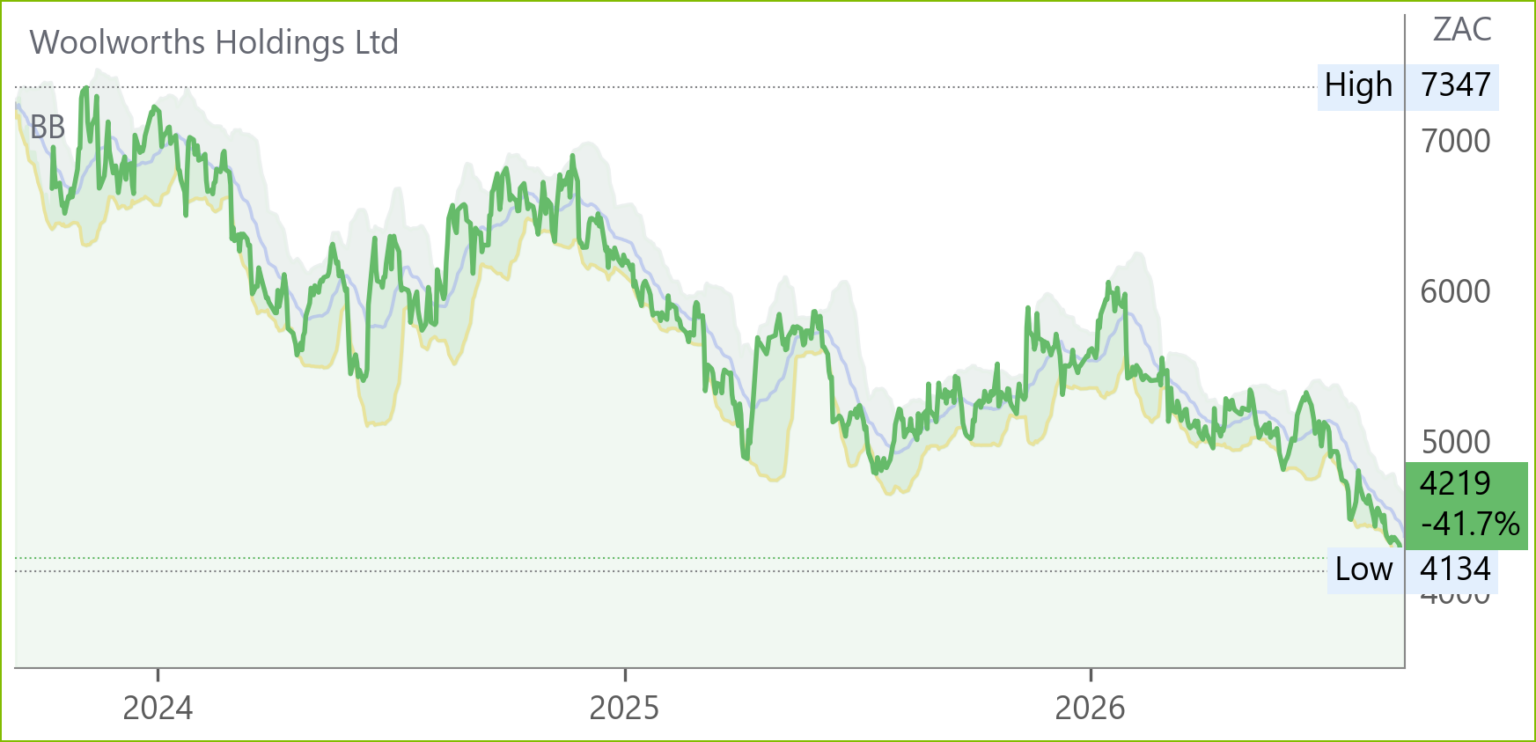
HEPS: 282.3cps (+5.3% from FY25)
EPS: 263.0cps (-3.8% from FY25)
Operating Profit: R3.2bn (+5.2% from FY25)
Revenue: R82.8bn (+4.2% from FY25)
Gross Profit: Food margin stable at 24.9%; FBH margin down 130bps to 46.0%
EBITDA: R8.9bn (+2.8% from FY25)
Dividend: 199.0cps (+5.9% from FY25), final dividend 81.0cps
Turnover rose 4.3% to R84.5bn, with Food outperforming (+5.7%) and online sales contributing 7.3% of SA Food revenue. FBH faced margin pressure from promotions and weaker demand, with EBIT down 14.1%. Country Road Group returned to profitability, aided by reduced discounting and margin expansion. Net borrowings increased to R5.9bn, but cash conversion improved to 104.5% and free cash flow reached 449.4cps.
Comments: WHL results are broadly in line with pre-guidance, with adjusted HEPS up 3.7% YoY and Food margins resilient. Fashion, Beauty & Home (FBH) deteriorated on discounting and Kidswear dilution, driving a 14% EBIT decline, while Woolworths Financial Services (WFS) impairments rose amid consumer strain. Country Road Group (CRG) returned to profit post-restructure, and cash conversion was strong at 104.5%. Post-period sales trends are weak across divisions, highlighting tough SA and Australia conditions. At 11.3x fwd P/E, downside risk remains given softer trading momentum and margin pressure *.
*Effective 21 September 2026, Aspen will replace Woolworths in the SA Alsi 40 Index. This significant reshuffle reflects Woolworths’ underperformance and provides Aspen with long‑term structural support, reinforcing its position within flagship portfolios and strengthening its role as a core South African equity benchmark constituent.
Truworths (TRU) Financial Results for 52W Jun ’26 (4580c)
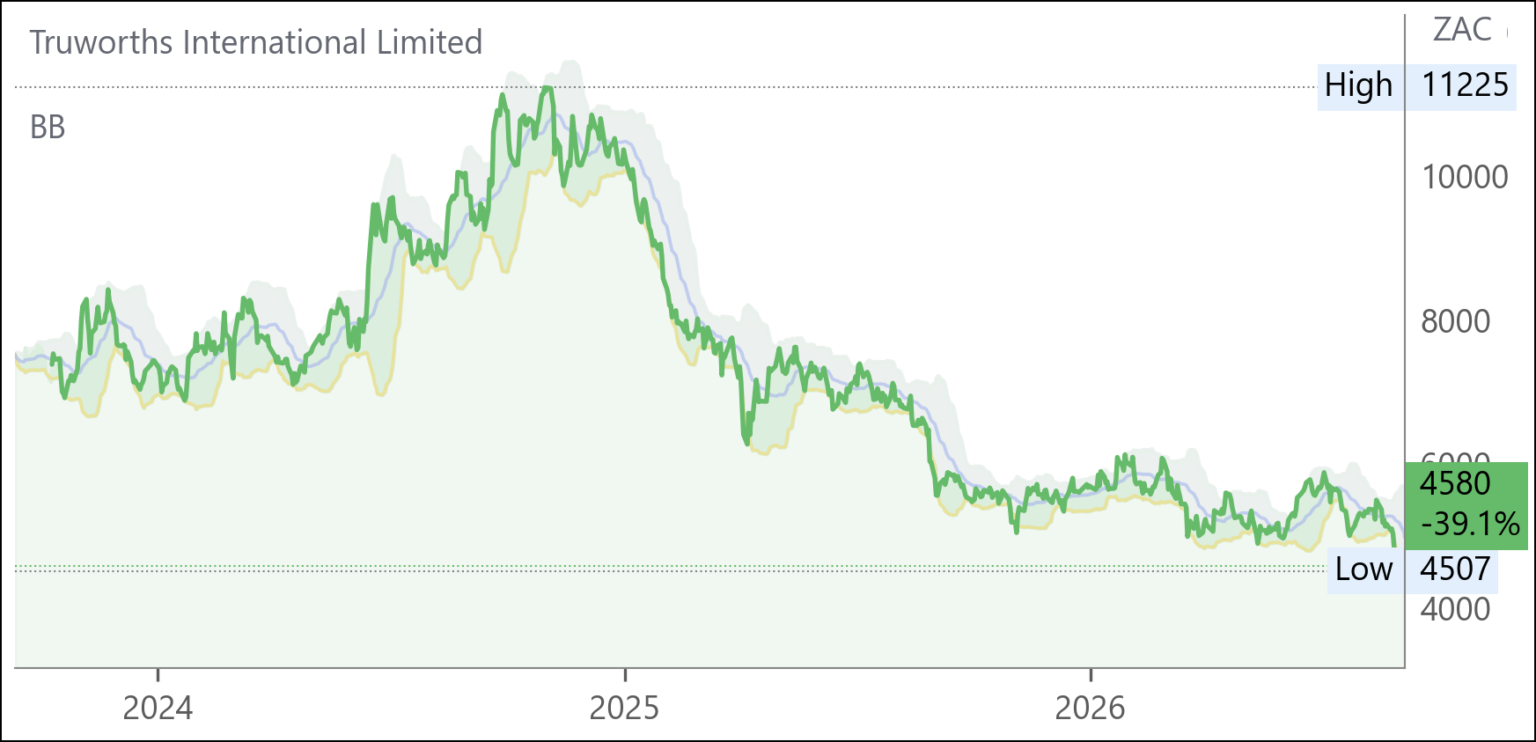
HEPS: 732.2c (–3% from 752.1c FY25)
EPS: 724.6c (–3% from 745.2c FY25)
Operating Profit: Margin 19.2% (FY25: 20.0%)
Revenue: R21.8bn (–0.9% from R22.0bn FY25)
Gross Profit: Margin 51.3% (unchanged)
Dividend: 474c per share (final 153c; FY25: 170c)
NAV: 2 845c per share (–0.5% from 2 859c FY25)
Truworths reported softer FY26 results, with retail sales down 0.9% to R21.8bn and operating margin easing to 19.2%. HEPS declined 3% to 732.2c, while EPS fell 3% to 724.6c. Gross margin remained stable at 51.3%. Cash generation from operations was R4.2bn, supporting a dividend of 474c per share, including a final payout of 153c. The group repurchased 17.1m shares at a cost of R949m, reducing net cash to R196m. Chairman Hilary Saven and CEO Michael Mark emphasised resilience in a challenging retail environment, with continued focus on cost discipline and shareholder returns.

Discovery* (DSY) Financial Results FY26 (26243c)
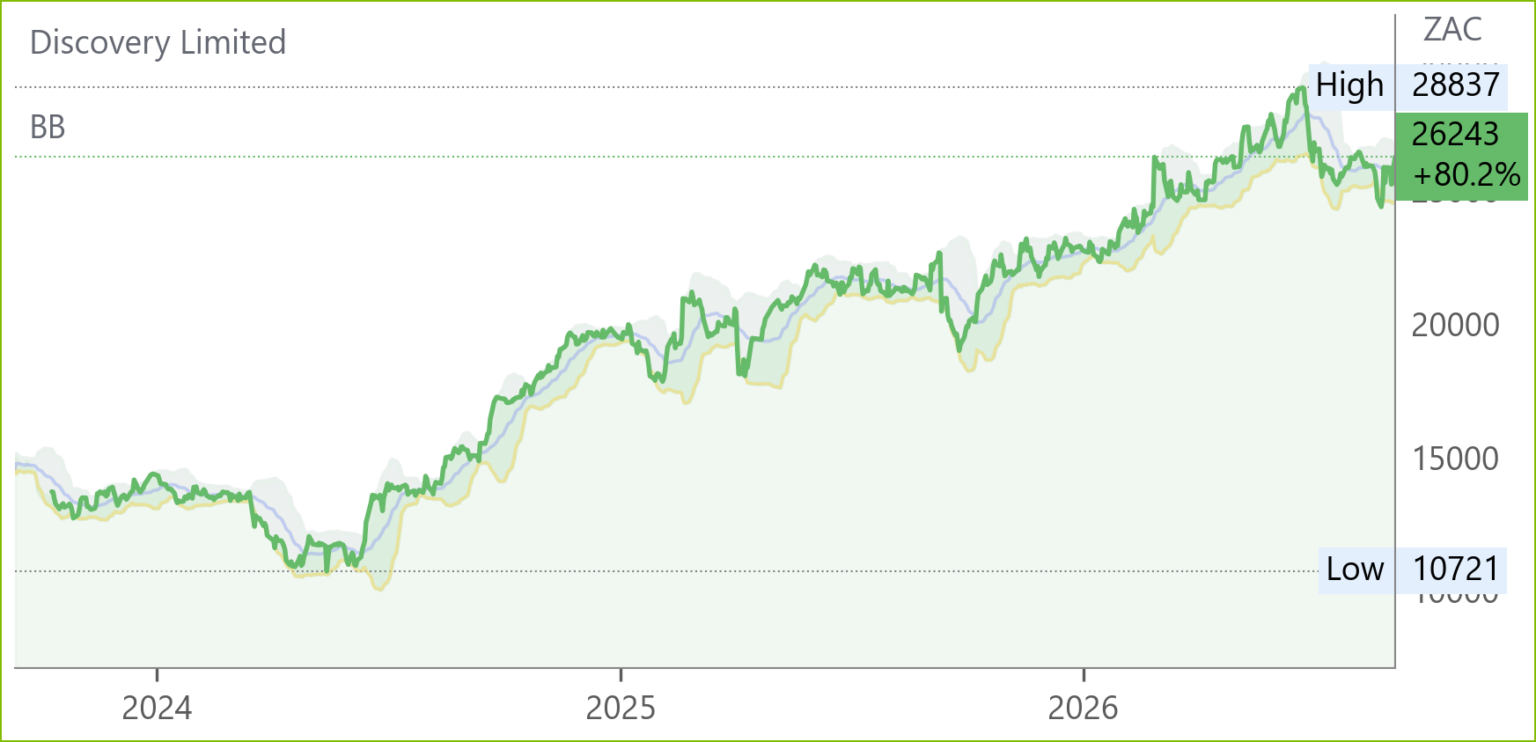
HEPS: 1 926c (+33% from 1 447c)
EPS: 1 937c (+38% from 1 402c)
Operating Profit: R17.75bn (+17% from R15.21bn)
Dividend: 273cps final (+36% from 201cps)
Discovery reported strong FY26 results, with normalised operating profit up 17% to R17.75bn and headline earnings rising 34% to R12.9bn. EPS grew 38% to 1 937cps, supported by gains from the early termination of the 1 Discovery Place lease and the partial sale of Cambridge Mobile Telematics. Embedded value increased 13% to R142.9bn, with RoEV at 14.1%. Discovery South Africa delivered 16% profit growth, driven by Health, Life, Invest, Insure and Bank, the latter scaling rapidly with >600% profit growth. Vitality’s operating profit rose 21%, with strong UK and Ping An Health contributions, though Japan weighed on Global Markets. The Group declared a final dividend of 273cps.
Comment: CEO Adrian Gore emphasised Discovery’s evolution into a “super bank” ecosystem, integrating health, protection, wealth and banking, while leveraging AI and behavioural science to compress morbidity and enhance long‑term shareholder value. Discovery Bank has rapidly scaled to over 1.4m clients (+28% YoY), with ~70% new to Discovery. Revenue grew 34% in H1 FY26 to ~ZAR2.4bn, now ~2.5% of group revenue. Profitability was achieved in FY25, with management guiding ~ZAR400m annual profit growth and a long‑term target of ZAR3bn operating profit at 2–2.5m clients. Positioned as SA’s fastest‑growing retail bank, Discovery Bank’s digital, shared‑value model is set to become a meaningful earnings driver, with strong growth momentum and expanding contribution to group HEPS.
Santam* (SNT) Interim Results for 6M Jun ’26 (41100c)
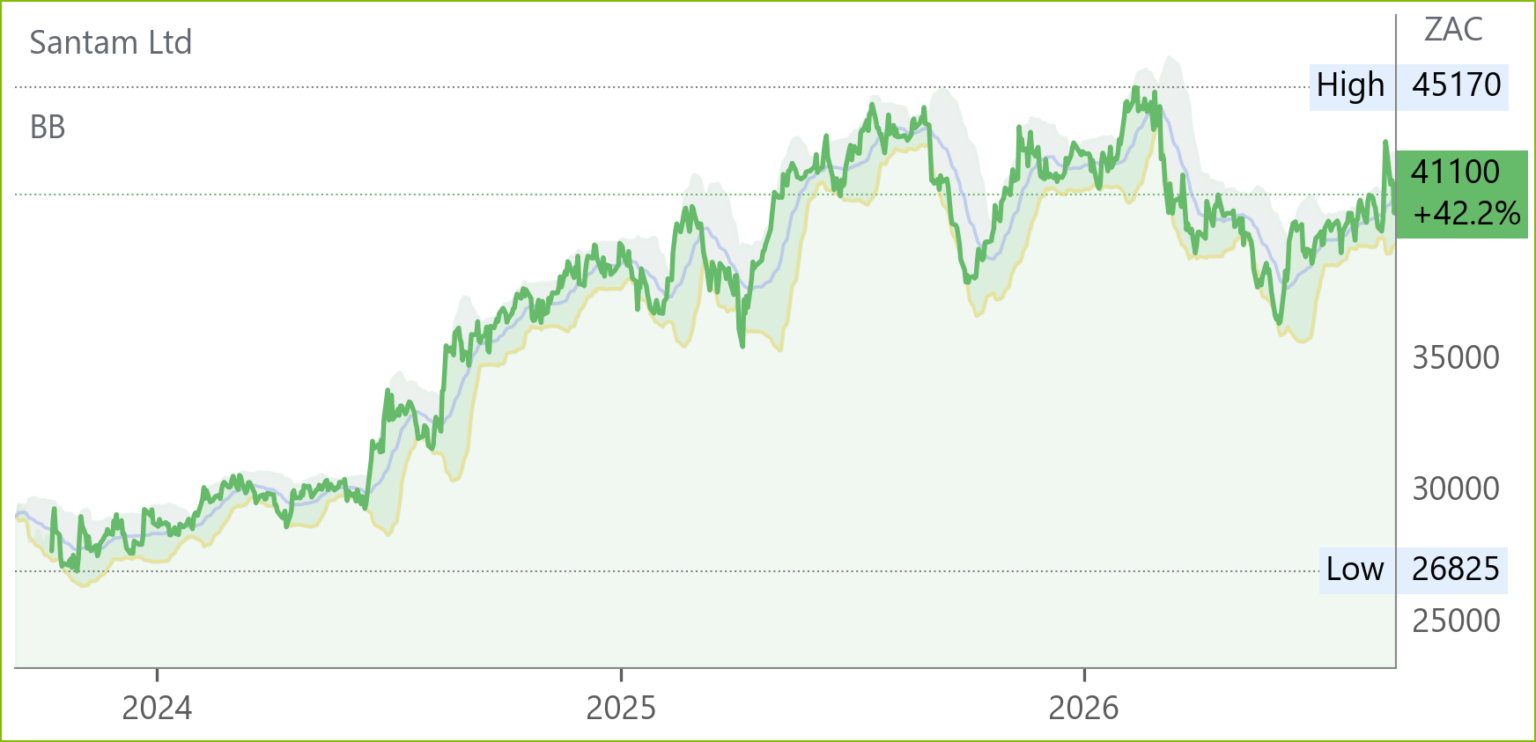
HEPS: 2 006c (+7% from 1 873c)
EPS: 2 006c (+7% from 1 873c)
Revenue: R27.96bn (+2% from R27.50bn)
Dividend: 650cps interim (up 10% from 590cps)
Santam delivered a resilient HY26 performance, with insurance revenue up 2% to R27.96bn and HEPS rising 7% to 2 006cps. Conventional insurance NEP grew 6% to R18.9bn, though underwriting margin softened to 8.1% from 11.3% due to R1.5bn in weather‑related catastrophe and fire losses, compared to only R144m in HY25. The ART division grew profit 12% to R466m, while international expansion gained traction through Syndicate 1918 in London (EPI R1.3bn) and the new GIFT City office in India. Annualised return on shareholders’ funds was 27% (HY25: 33.2%), with economic capital coverage at 167%. An interim dividend of 650cps was declared, reflecting confidence in capital strength. CEO Tavaziva Madzinga noted continued delivery on the FutureFit 2030 strategy despite challenging conditions.

ADvTECH (ADH) Interim Results for 6M Jun ’26 (4925c)
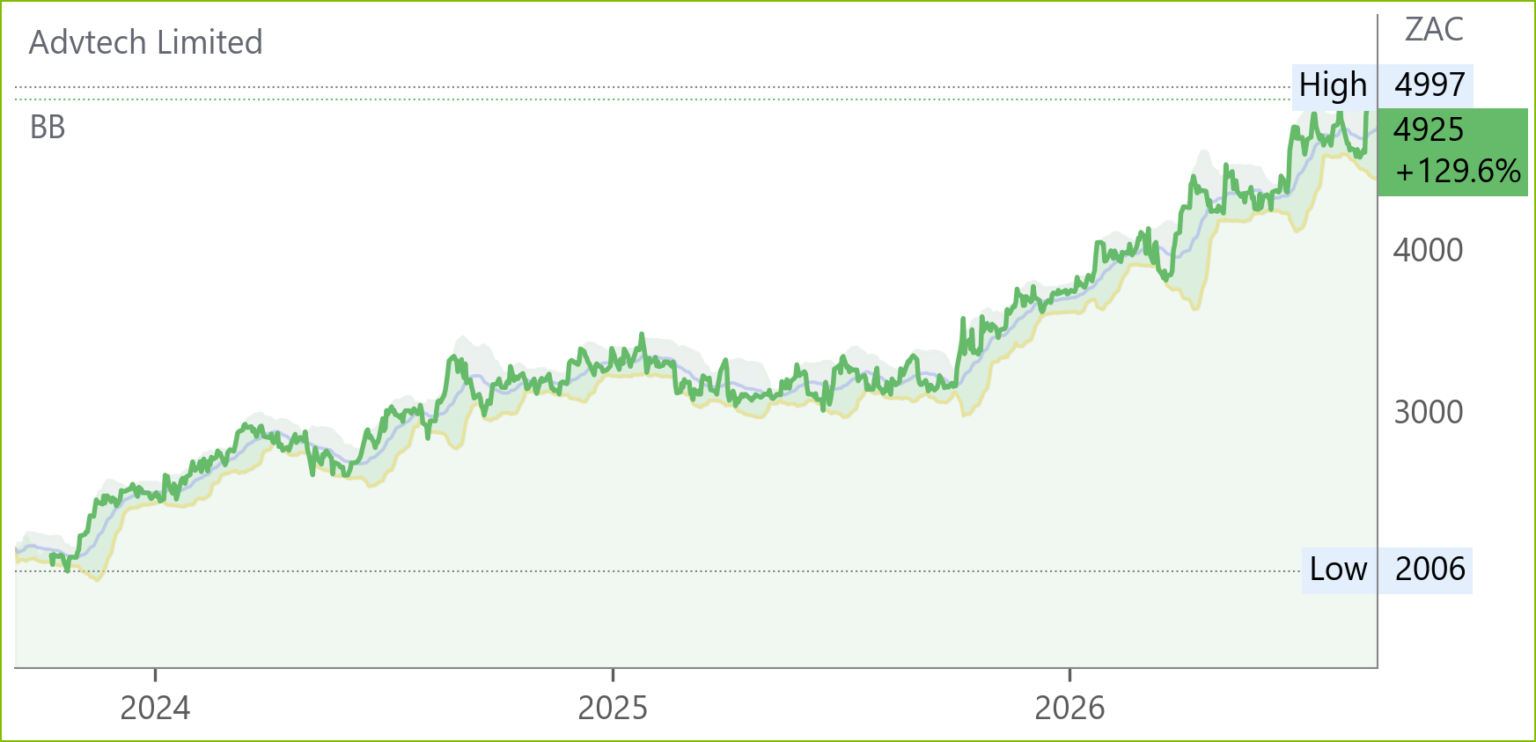
HEPS: 130.8c (+16% from 112.7c)
EPS: 129.4c (+15% from 113.0c)
Operating Profit: R1.12bn (+14% from R982m)
Revenue: R5.06bn (+8% from R4.68bn)
Dividend: 53.0c per share (interim, +18% from 45.0c)
ADvTECH delivered strong interim results for H1 ’26, with revenue up 8% to R5.06bn and operating profit rising 14% to R1.12bn. HEPS increased 16% to 130.8c, while EPS grew 15% to 129.4c, supported by robust demand across education and staffing divisions. Normalised earnings advanced 16% to R717m, reflecting effective cost management and solid cash generation. The board declared an interim dividend of 53c per share, up 18% year-on-year, maintaining a 2.0x cover policy. CEO Geoff Whyte emphasised continued investment in academic excellence and digital learning platforms to drive sustainable growth. Outlook remains positive, with strong enrolment trends and resilient demand for skills development.
Comment: ADvTECH management has delivered an exceptional set of results. Following the simplification of the tertiary schools into Emeris and Rosebank, the current focus is on simplifying the schools sector into their four flagship brands, which are well recognised across the country (Trinity, Crawford, Abbotts, International Schools). There is a healthy pipeline of capex projects (new schools, relocations and expansions) expected to yield WACC+6%. Operating margins have expanded across all education sectors, and the focus is on expanding capacity in the higher margin segments, namely Rest of Africa and tertiary education. Several relocations and expansions have already completed in the past 12 months, with significant capacity expected to be added in the upcoming 2 years, notably the KZN Emeris campus with capacity for over 10 000 students, which represents under half of expected capacity add currently in the pipeline. CEO Geoff Whyte guided that demand for the services ADvTECH provides far outpaces the supply they can offer, both in SA and rest of Africa, and believes they are set to benefit with tailwinds of the failing state educational institutions.
On top of the growth prospects, the balance sheet health is continually improving, with gross debtors as % of revenue; and LCA as % of gross debtors both trending lower over 5 years. With D/E at 25%, dividend coverage of 2x and net borrowings to cash generation of 0.1, the company is well positioned to grow without financial headwinds moving forward. These results reflect a well-executed strategy, and the expectation is this trend will continue. The Emeris and RUIC brands expected to achieve full university status in the next 1-2 years, which will be a major boost. On a PE of 19 and trailing PEG of 0.88 (compared to Stadio PE 33 and trailing PEG 1.58), ADvTECH can be bought on any pullbacks off all time highs.
STADIO (SDO) Interim Results for 6M Jun ’26 (1270c)
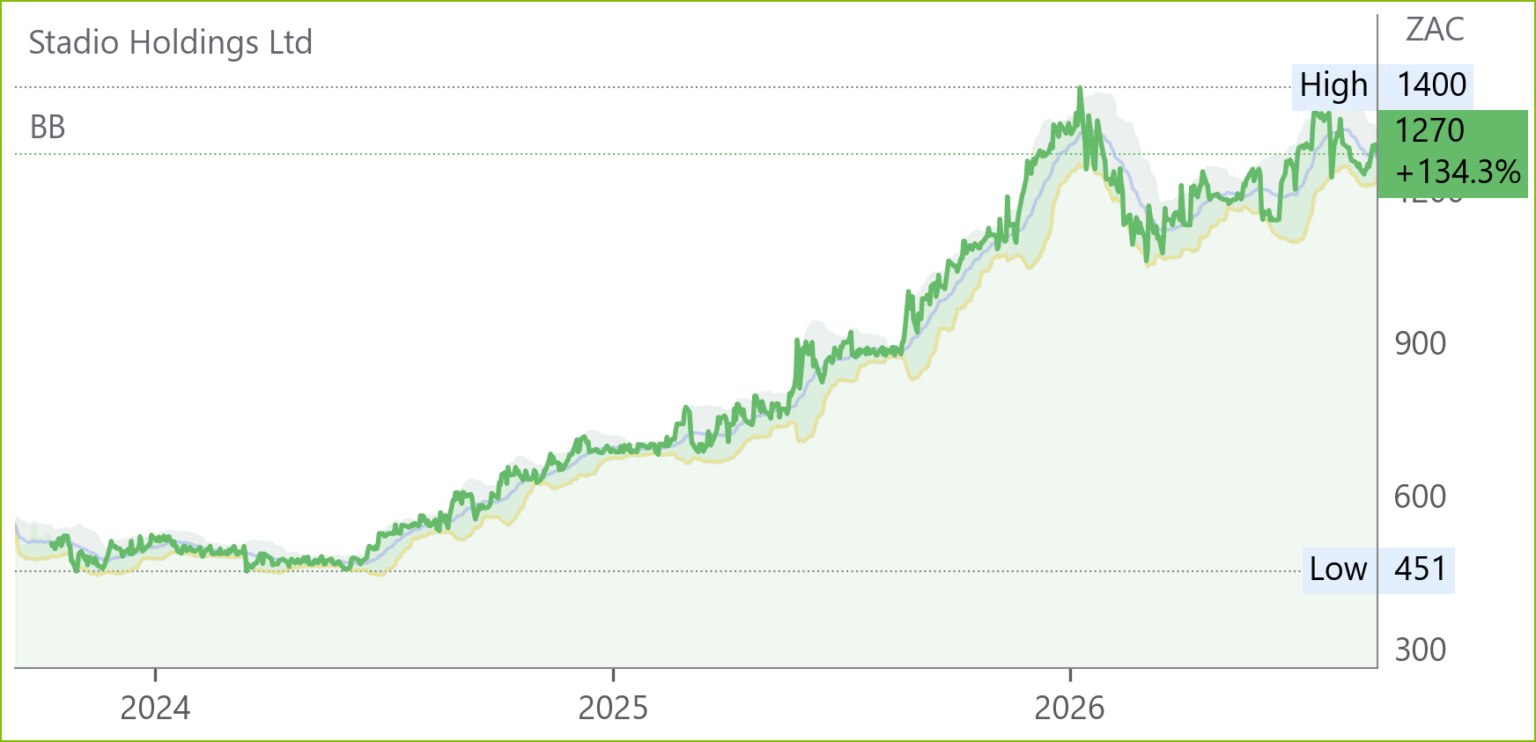
HEPS: 24.0c (+16% from 20.7c)
EPS: 24.0c (+15% from 20.8c)
Revenue: R1.08bn (+13% from R957m)
EBITDA: R333m (+14% from R293m)
NAV: 246c (+5% from 234c)
Revenue growth of 13% was driven by a 10% increase in student numbers, surpassing the pre-listing milestone of 56,000 students. Contact learning surged, with STADIO Higher Education student numbers up 33% and new enrolments up 43%, supported by the opening of Durbanville and AFDA Hatfield campuses. Durbanville exceeded expectations with over 1,250 students. The launch of Engineering qualifications broadened academic offerings. Core headline earnings rose 18% to R207m, reflecting operational strength. No interim dividend was declared, consistent with the annual dividend policy. CEO Chris Vorster emphasised the Group’s 2030 ambition of 80,000 students and achieving university status once regulations permit.
Comment: Another exceptional set of results from the top , with earnings and operating profit growth outpacing revenue growth. Similarly to ADvTECH, tailwinds from failing state institutions should support demand for Stadios’ services going forward. Their positioning as a predominantly distance learning institute (80/20 distance/contact learners goal) is reflective in their lower revenue per student, but strong operating profit margin of 31%. Stadio Higher Education, Milpark and AFDA operate as separate entities with their own strategies, which serves as an income diversifier for the group but means they lose out on operational efficiencies. The half year ended with R430m operating cash flow, up 21% from prior period, and credit loss allowances remained stable at 8.7% of revenue (slightly higher than ADH). CEO Chris Vorster pointed out challenges at AFDA this year from the rise of the streaming services, namely Canal+ in South Africa, but insists they are temporary and behind them. Trading at a PE of 33 (vs ADH at 19), is reflective of the expected superior growth, however, assessing trailing PEG ratios indicates the share price might be overvaluing the growth story as of right now.

Bidvest* (BVT) Financial Results FY26 (23000c)
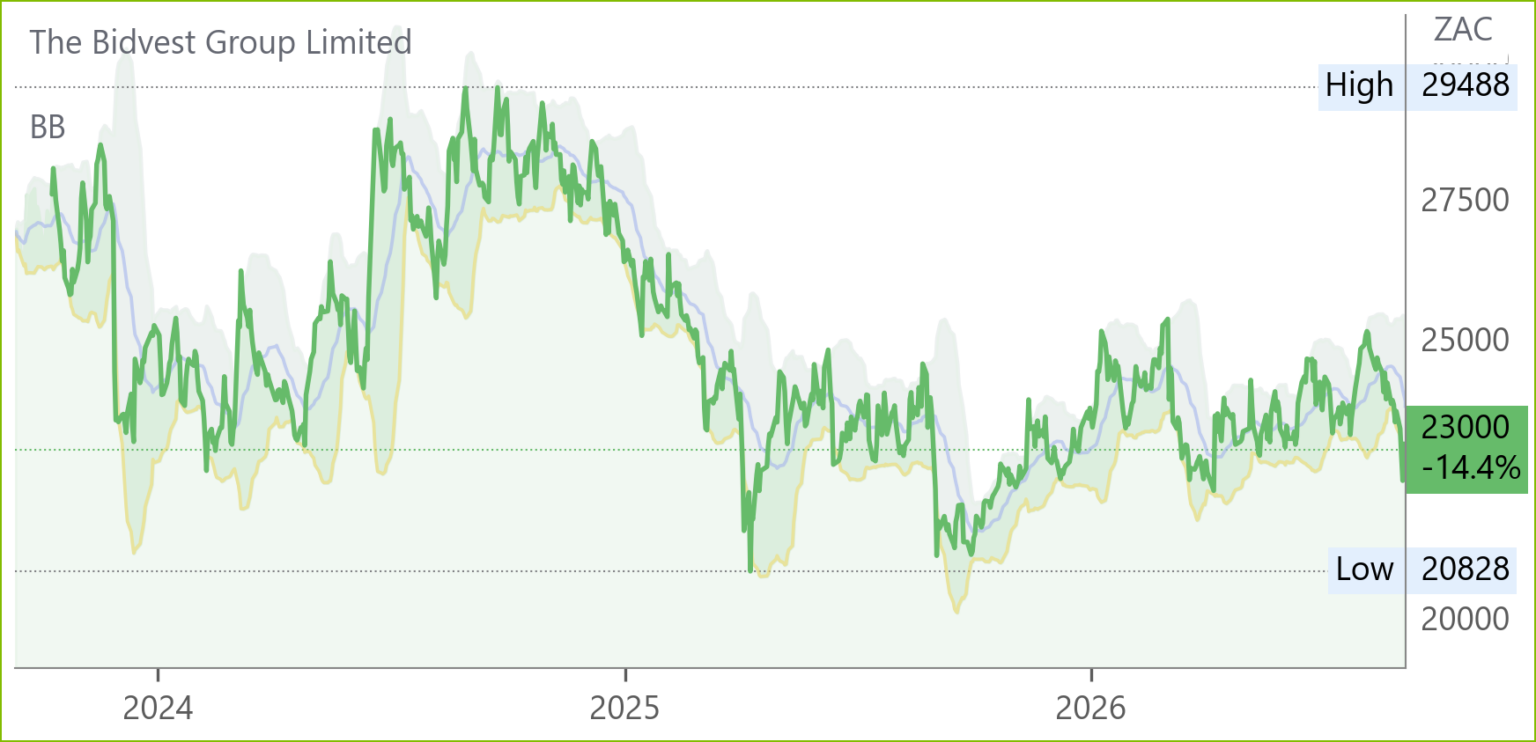
HEPS: 1 864.2c (+6% from FY25)
EPS: 1 808.4c (+1.3% from FY25)
Operating Profit: R13.1bn (+8% from FY25)
Revenue: R130.3bn (+3% from FY25)
Dividend: 483c per share (final, +7% YoY)
Bidvest reported steady FY26 growth, with revenue up 3% and operating profit rising 8% to R13.1bn. HEPS increased 6% to 1 864.2c, while EPS rose modestly (+1.3%) due to discontinued operations. Strong cash generation lifted operating cash flow 17% and free cash flow 27%, reducing gearing to 1.9x. Strategic progress included securing a 25‑year Island View port lease and R2.5bn capex approval for bulk terminal expansion. Integration of Citron UK/North America and Aquatico strengthened hygiene and TIC divisions. Outlook remains positive, supported by hygiene, TIC, hospitality, and port infrastructure demand, though competitive pricing and energy volatility pose risks.
Comment FY26 results showed steady progress, with organic revenue up 1.5% and trading profit up 5%. Normalised diluted HEPS rose 4.2% to 2,032cps, supported by record free cash flow of R7.4bn (107% conversion). Net debt/EBITDA improved to 1.9x; Dividend grew 6.6% to 978cps (4.1% yield). Offshore acquisitions – Citron UK/North America and Aquatico – totalled R17bn and have yet to deliver incremental growth, with international profit share down to 25.2%. Forecasts imply a 6.8% CAGR to FY29E; valuation unchanged at 12,7 x P/E.
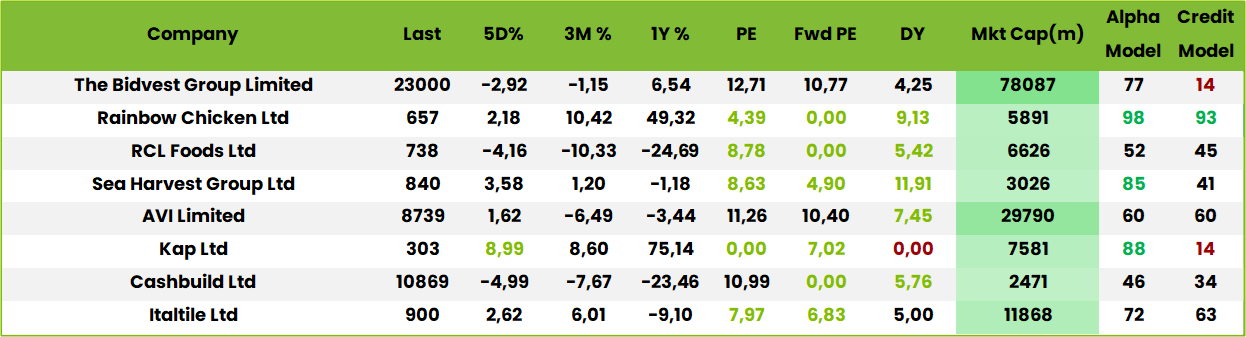
Rainbow Chicken (RBO) Financial Results FY26 (657c)
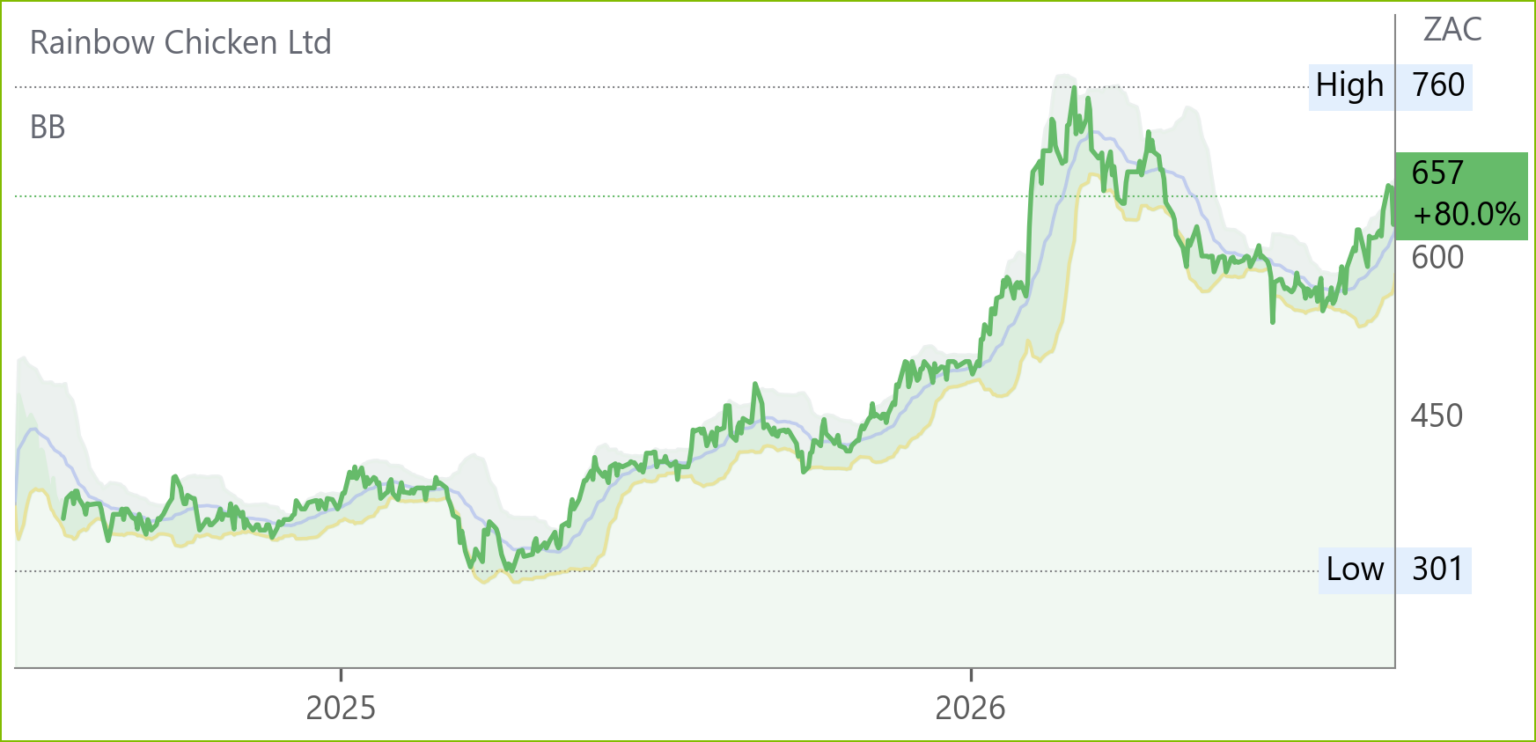
HEPS: 150.87c (+130.1% from 65.57c)
EPS: 149.55c (+133.5% from 64.04c)
Revenue: R17.05bn (+7.7% from R15.84bn)
EBITDA: R2.14bn (+101.8% from R1.06bn)
Dividend: 45c final + 75c special (total 135cps)
Robust poultry demand, lower commodity input costs and operational efficiencies drove a sharp rebound in profitability. EBITDA more than doubled, lifting margins to 12.5%. The Chicken Division benefited from firm pricing and improved agricultural yields, while the Feed Division delivered higher‑margin volumes despite softer raw material prices. Cash reserves rose to R2.4bn, supporting a special dividend of 75cps in addition to a 45cps final dividend. Management highlighted strategic capital allocation and low gearing as enablers of shareholder returns. The Rustenburg waste‑to‑value plant showed improved performance but remains a focus area. Management outlook remains positive with continued emphasis on product mix optimisation and efficiency gains.
RCL Foods (RCL) Financial Results FY26 (738c)
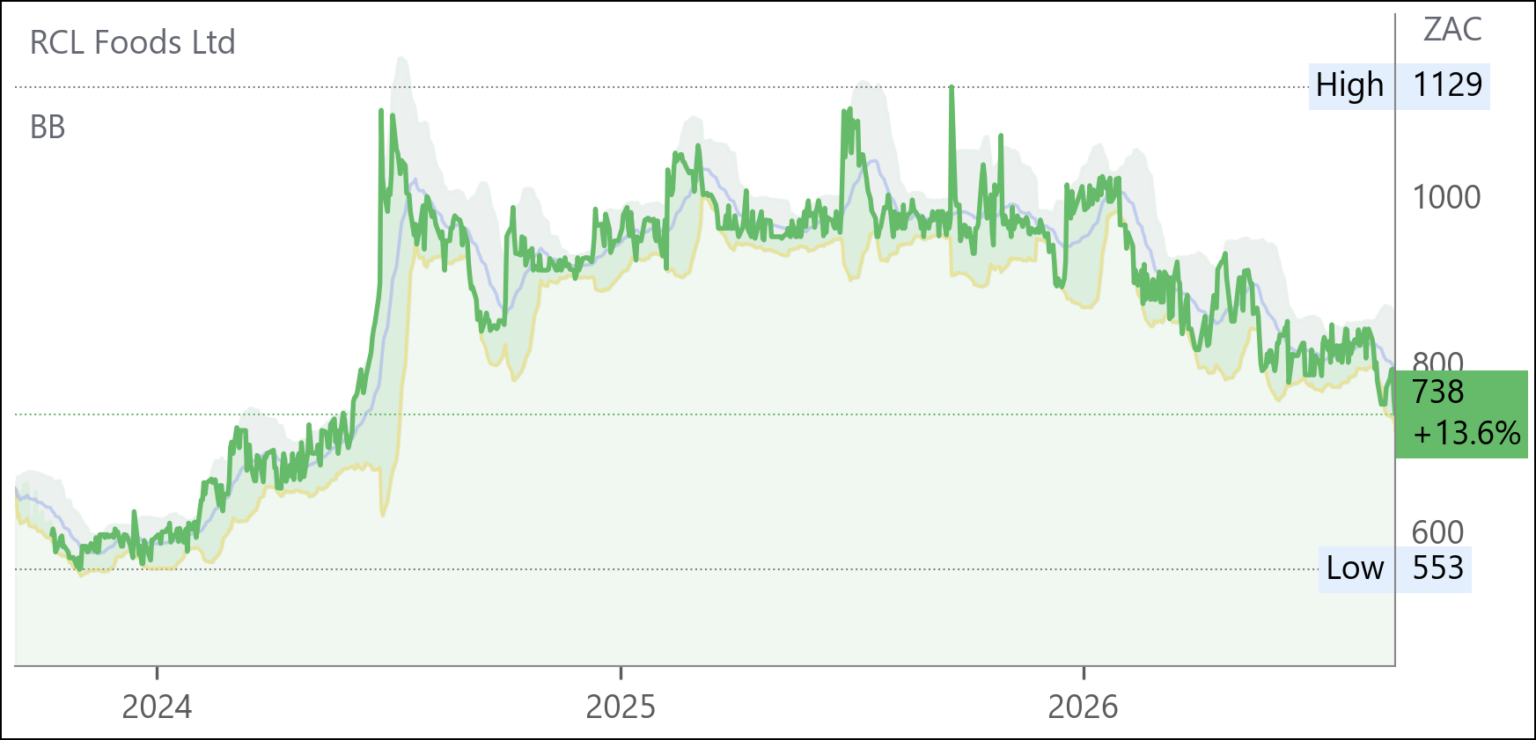
HEPS: 105.1c (‑32.8% from 156.3c)
EPS: 84.1c (‑53.3% from 180.1c)
Revenue: R24.5bn (‑4.1% from R25.5bn)
EBITDA: R2.17bn (‑15.2% from R2.56bn)
Dividend: 40c per share (final, ↓ from 60c)
RCL Foods reported sharply lower FY26 earnings, with HEPS down 33% and EPS down 53% following weaker Sugar and Pet Food results. Sugar was hit by deep‑sea imports displacing local sales into the lower‑priced export market, compounded by a 22.6% fall in global raw sugar prices and ineffective tariff protection. Pet Food was disrupted by a nationwide Salmonella recall, leading to production stoppages and stock write‑offs. Groceries delivered resilient performances in Culinary and Beverages, while Baking improved through efficiencies and pricing discipline. A R206m impairment was recognised in Sunshine operations after continued volume weakness post‑labour disruption. Outlook highlights recovery in Pet Food and improved sugar market balance after tariff revisions in Aug ’26.
Sea Harvest (SHG) Interim Results for 6M Jun ’26 (840c)
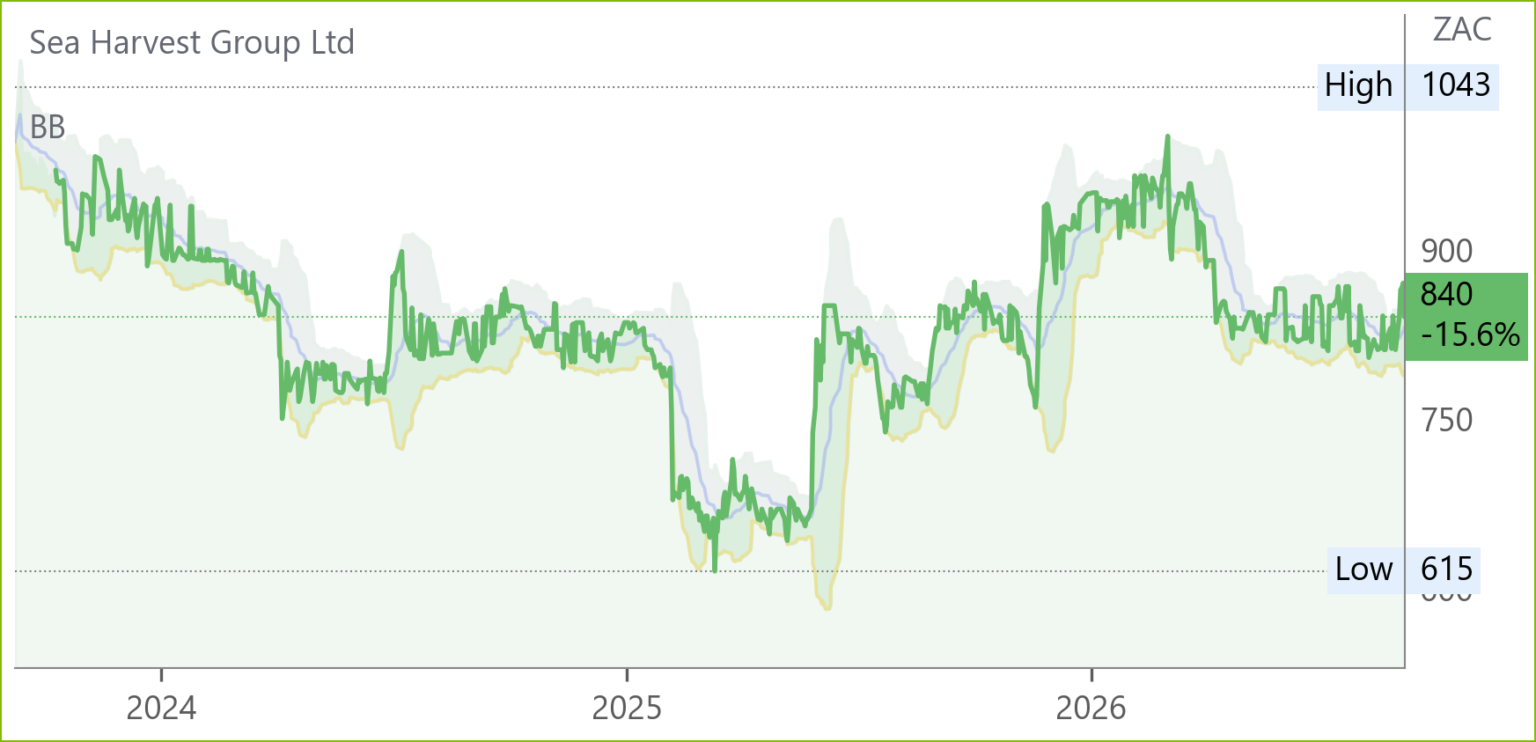
HEPS: 97c (+14% from 85c)
EPS: 97c (+10% from 88c)
Operating Profit (EBIT): R547m (+2% from R536m)
Revenue: R3.29bn (-6% from R3.49bn)
Gross Profit: R1.05bn (-8% from R1.14bn)
Dividend: 24c interim (maiden)
NAV: 1264c (+2% from 1242c)
Revenue fell 6% to R3.29bn due to weaker pelagic volumes and the Pilbara trawl ban in Australia, but firm global demand and price increases lifted EBIT margin to 17%. HEPS rose 14% to 97c, supported by disciplined cost control, hedge gains, and improved aquaculture performance. Net debt reduced by R560m to R1.66bn, with net debt/EBITDA improving to 1.1x. A maiden interim dividend of 24c was declared. Management noted resilience despite headwinds from fuel costs, TAC reductions, and currency strength, with firm demand in hake and prawn markets expected to support H2.
KAP (KAP) Financial Results FY26 (303c)

HEPS: 45.2c (+88% from 24.1c)
EPS: -4.8c (loss vs 0.4c)
Operating Profit: R2 473m (+28% from R1 937m)
Revenue: R29 606m (flat vs R29 615m)
NAV: 486c (-2.4% from 498c)
Revenue was flat year-on-year, but operating profit rose 28% to R2.47bn, reflecting efficiency gains. HEPS surged 88% to 45.2c, though EPS showed a small loss due to capital items. NAV per share declined slightly to 486c. No dividend was declared. Management emphasised improved profitability despite stagnant revenue, with stronger margins supporting earnings growth.
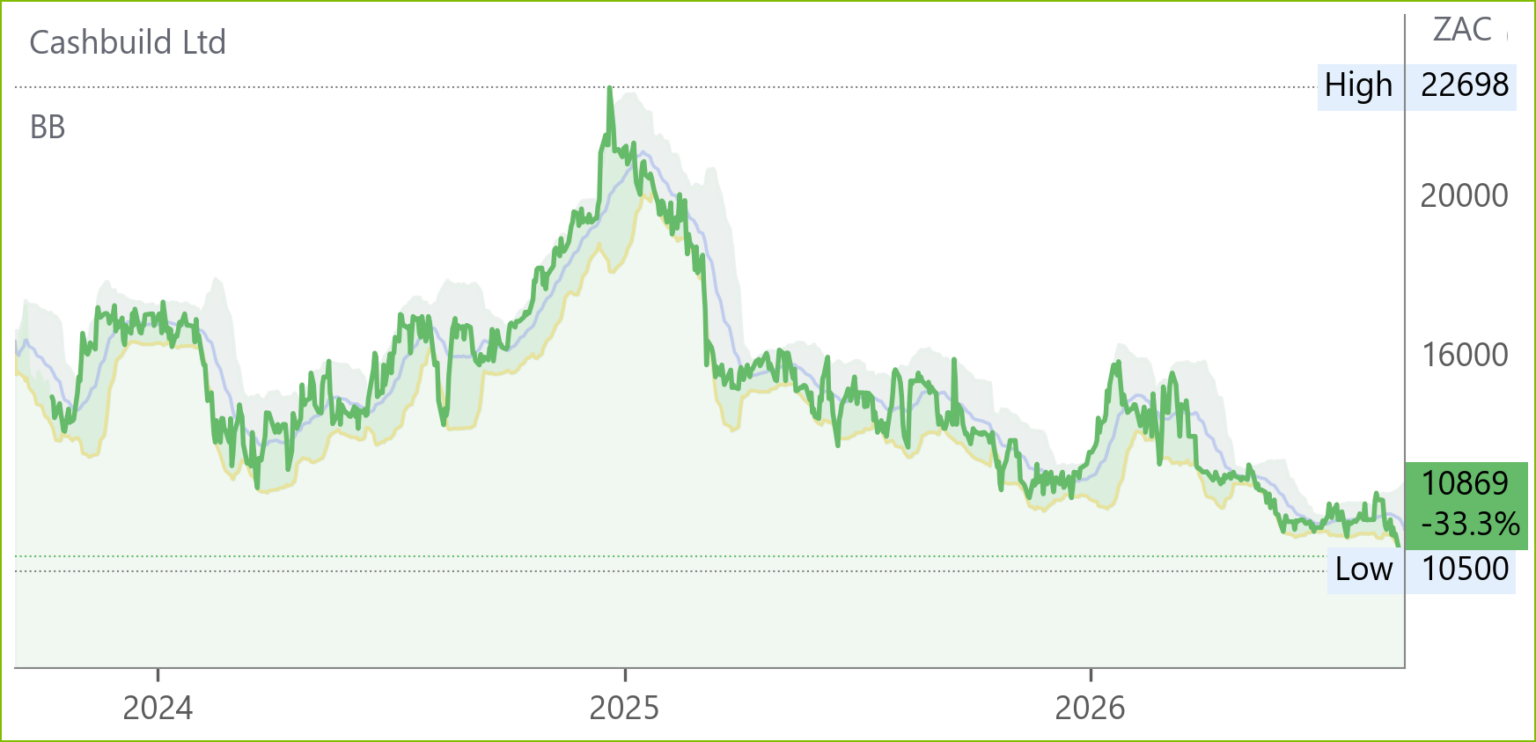
Cashbuild (CSB) Financial Results for FY26 (10869c)
HEPS: 959.9cps (−8% from 1040.4c)
EPS: 786.1cps (−25% from 1042.5c)
Operating Profit: R292m (−15% from FY25)
Revenue: R12.1bn (+6% from FY25)
Gross Profit: R3.1bn (+8% from FY25)
Dividend: 626cps (flat YoY, final dividend 233cps)
NAV: 7784cps (−3% from FY25)
Cashbuild grew revenue 6% to R12.1bn, supported by 20 new stores and a 5% increase in transactions. Gross margin improved to 25.3%, but operating profit fell 15% due to higher expenses and a R34.9m loss on disposal of the Malawi subsidiary, driving EPS down 25%. HEPS declined 8%, reflecting underlying resilience. The group opened 9 new stores, closed 11 underperformers, acquired 3 Amper Alles outlets, and refurbished 19 stores. Net cash rose 4% to R2bn, while inventory increased 7%. Management expects trading conditions to remain challenging, with revenue flat in the first 7 weeks of FY27.
Italtile (ITE) Financial Results for FY26 (900c)

HEPS: 113.4c (−9.4% from 125.1c)
EPS: 113.1c (−10.0% from 125.6c)
Operating Profit: R1.8bn (−10.4% from R2.1bn)
Revenue: R11.3bn (+0.6% from R11.3bn)
Dividend: 45.0c per share (ordinary, −10% from 50.0c) + 25.0c special (vs 98.0c)
NAV: 653.6c (−7% from 705.0c)
Net Cash: R1.7bn (−21% from R2.2bn)
Italtile reported subdued FY26 results, with turnover flat at R11.3bn and trading profit down 10.4% to R1.8bn. HEPS fell 9.4% to 113.4c, while EPS declined 10% to 113.1c, reflecting margin pressure from rising input costs and excess manufacturing capacity in Southern Africa. Net cash decreased 21% to R1.7bn, and NAV per share fell 7% to 653.6c. Outlook remains cautious given geopolitical and domestic headwinds, though anti‑dumping duties on imported tiles are expected to support margins.
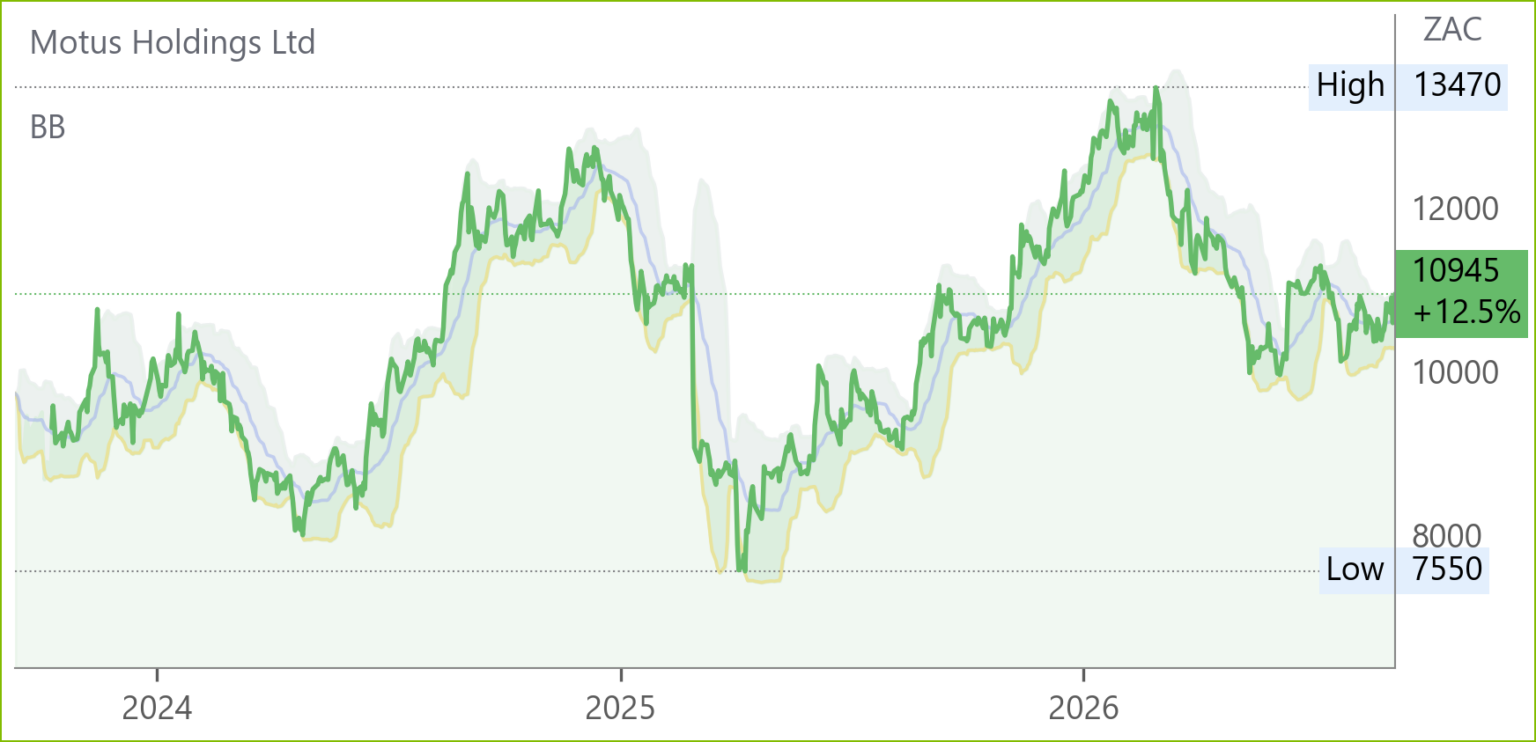
Motus (MTH) Financial Results for FY26 (10945c)
HEPS: 1777cps (+15% from FY25)
EPS: 1753cps (+19% from FY25)
Operating Profit: R5.7bn (+4% from FY25)
Revenue: R113.6bn (+1% from FY25; adjusted +3%)
Dividend: 710cps (+29% from FY25), final dividend 410cps
NAV: 12 194c (+8% from FY25)
Supported by strong SA passenger vehicle sales (+12%) Motus delivered a strong balance sheet and robust cash generation. International operations faced margin pressure from higher UK employment costs and subdued Australian retail demand. New vehicle sales rose 11% to 128 160 units, while pre-owned volumes grew 3%. Sales of Chinese and Indian brands surged over 200% in SA, 300% in the UK, and 44% in Australia, reshaping the competitive landscape. Net debt reduced to R7bn, with liquidity of R10.7bn and covenant ratios well within limits. CEO OJ Janse van Rensburg emphasised disciplined capital allocation and sustainable value creation.
Comment: Motus delivered resilient FY26 results, with revenue up 1%, HEPS up 15%, and dividend growth of 29%. Performance was underpinned by surging Chinese imports and strong traction from Indian brands, notably Tata, which has quickly established itself as a top‑12 passenger brand in SA. Multi‑franchising has enabled efficient integration of new entrants without disrupting traditional brands. The aftermarket grew operating profit 20%, supported by an aging car park and private‑label expansion. While EV adoption remains limited in SA, Motus’ diversified footprint and disciplined execution continue to support earnings momentum across geographies.

Trading Statements & Updates
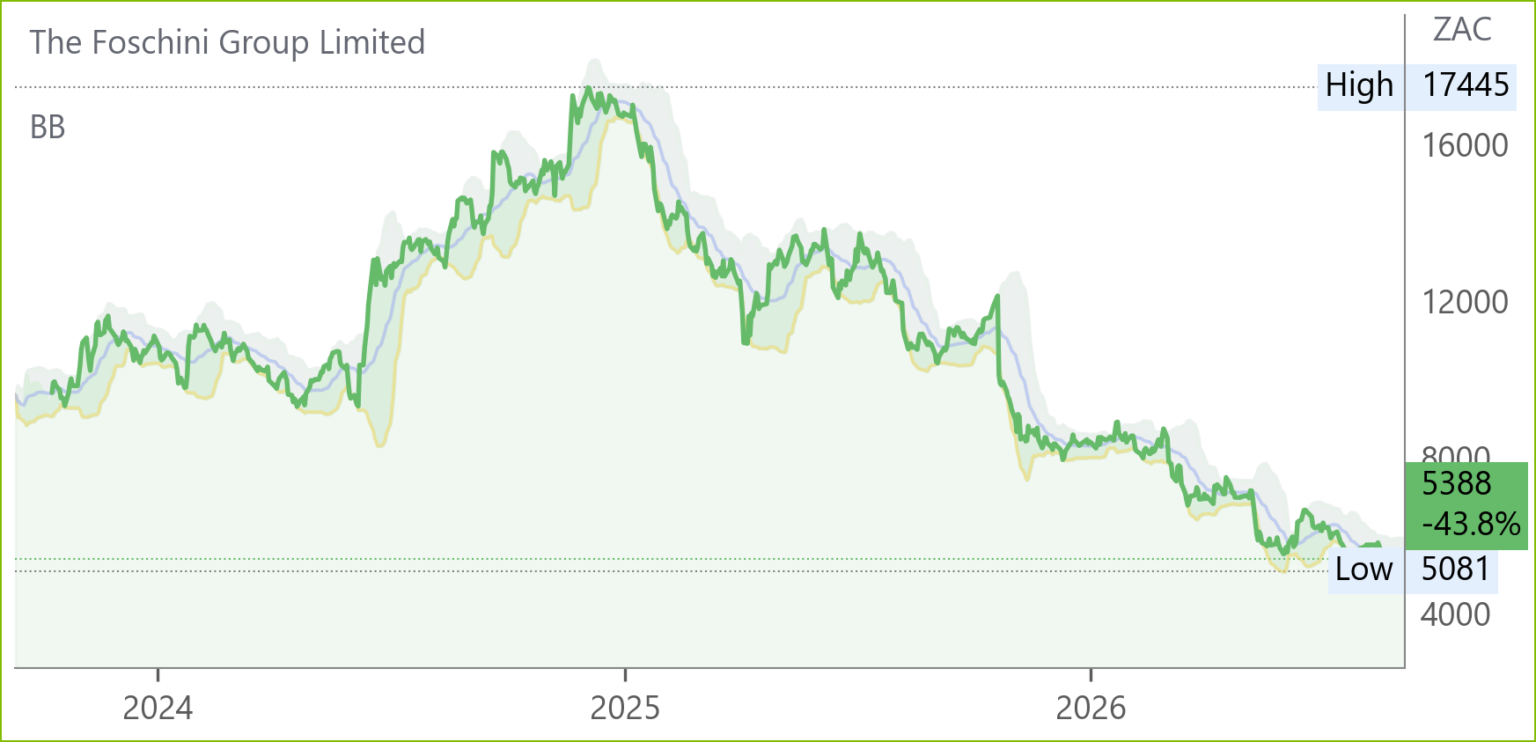
Foschini (TFG) Trading Update for 21W to Aug ’26 (5388c)
Revenue: R23bn (+0.2% YoY; +2.0% constant currency)
Gross Profit: broadly in line with prior period
Group sales edged up 0.2% to R23bn, with TFG Africa (+3.4%) and London (+2.3%) delivering growth, while Australia contracted 4.7% amid inflationary pressures and Tarocash brand repositioning. Online sales rose 15.3%, now 15.9% of group sales, with Bash driving 54.1% growth in Africa. Credit sales fell 2.5%, though acceptance rates improved to 20.3% and the debtors book expanded 4.5% to R9.6bn. 85 underperforming stores were closed, 25 new stores opened, and Phase Eight repositioning continued in London. Management expects global consumer pressure to persist, with ~80 further store closures projected in FY27 and up to 280 by FY2029. Net debt is forecast broadly in line with prior year, supported by inventory discipline and strict capital allocation.
Old Mutual* (OMU) Trading Statement for 6M Jun ’26 (1279c)
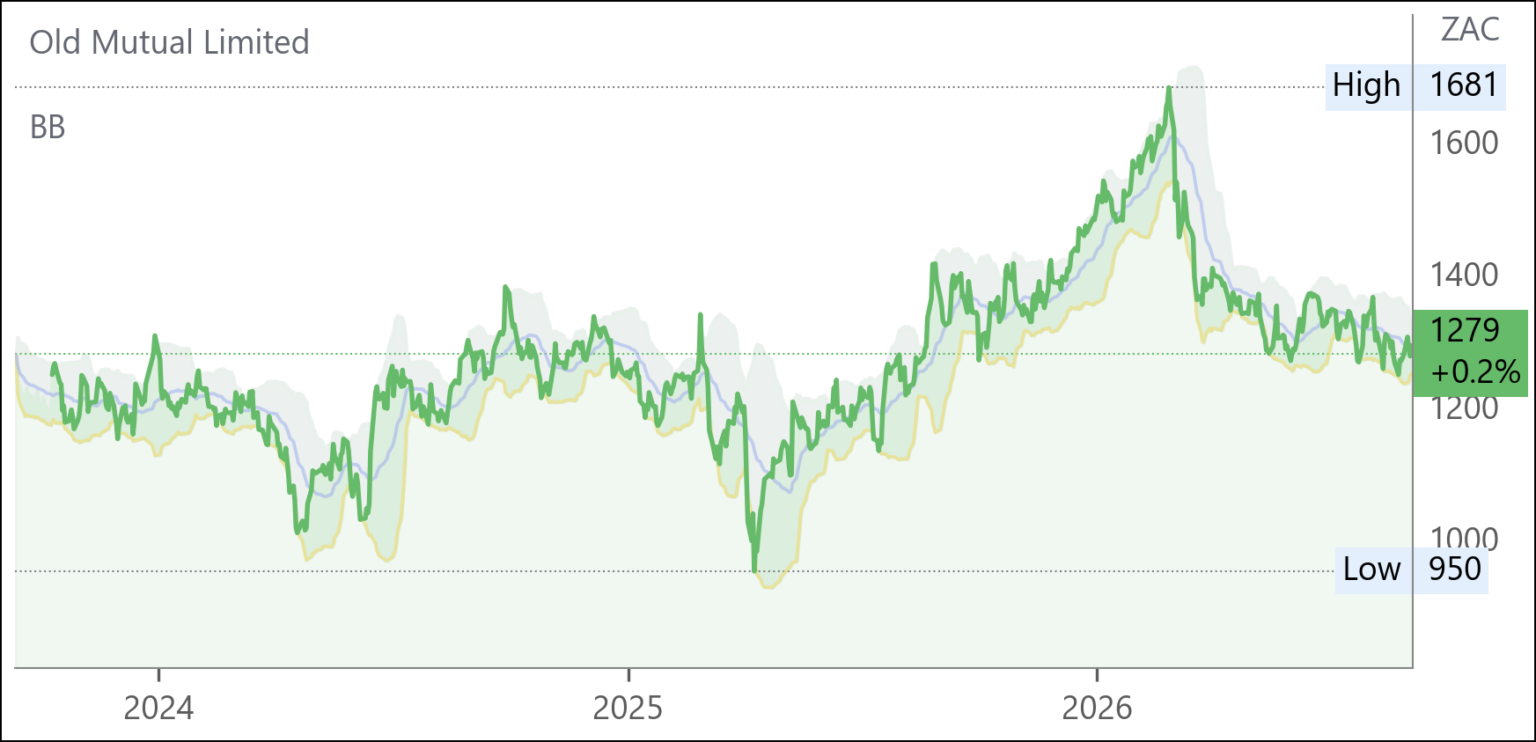
HEPS: 91.6c–101.4c (‑6% to +4% from 97.5c)
EPS: 91.3c–100.9c (‑5% to +5% from 96.1c)
Operating Profit (Results from operations): R5.04bn–R5.53bn (+2% to +12% from R4.94bn)
Revenue: Gross flows R128.9bn (+21% from R106.8bn)
Old Mutual reported strong new business growth, with Life APE sales up 21% to R7.9bn and gross flows rising 21% to R128.9bn, supported by Wealth Management inflows and the inclusion of 10X Investments. Net client cash outflows narrowed to R3.1bn from R10.1bn, while gross written premiums rose 3%. Value of new business increased 32% to R569m, with margins improving to 1.4%. Results from operations per share are expected to grow 6%–16%, but adjusted headline earnings per share will decline 22%–32% due to weaker shareholder investment returns amid risk‑off markets. IFRS profits benefited from Zimbabwe operations not included in adjusted headline earnings. Outlook highlights resilience in Wealth Management and Investments, though underwriting earnings softened and economic variances weighed on life businesses.
Reunert (RLO) Strategy Update FY26 (5463c)
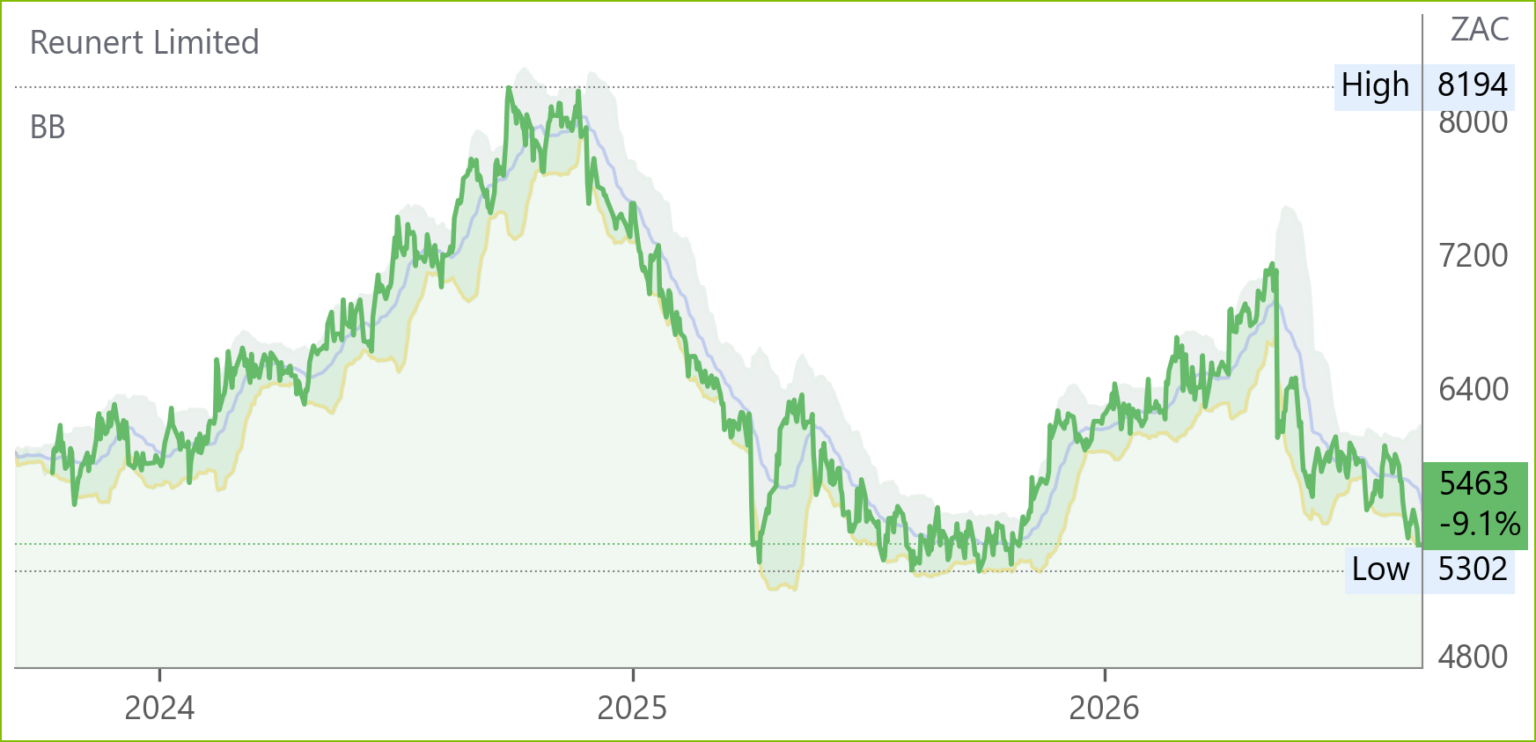
Revenue: 40% generated offshore in hard currency
Reunert highlighted persistent pressures in H2 FY26, including weak infrastructure‑led demand in South Africa and Zambia, adverse currency strength impacting exports, and supply‑chain disruption from Middle East conflict. Electrical Engineering demand for power cables remained subdued, prompting restructuring of local facilities to preserve core skills while retaining capacity for recovery. ICT benefited from prior restructuring but faced lower volumes and Nashua challenges. Defence Cluster order book remains strong, with US circuit breaker exports growing. Strategic refresh emphasises disciplined capital allocation and value creation, supported by the CSG fuse joint venture in Slovakia and Silversoft acquisition.
Altron (AEL) Operational Update HY27 (2690c)
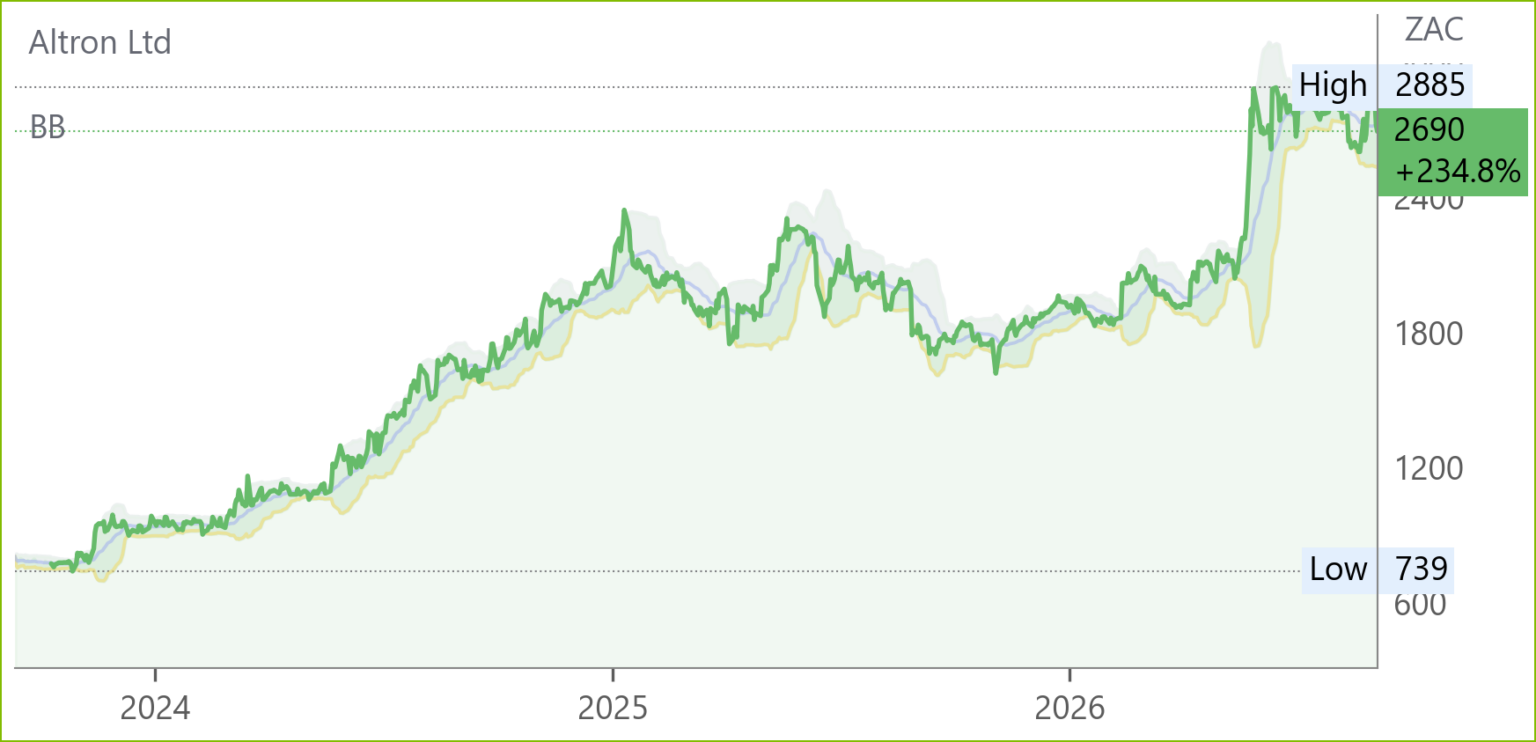
Operating Profit: Up low‑to‑mid teens (YoY)
Revenue: Low‑single‑digit growth (YoY)
EBITDA: Up low‑to‑mid teens (YoY)
Dividend: R750m paid Jun ’26, including special dividend
Altron reported sustained operational momentum into HY27, with Platforms delivering high‑single‑digit revenue growth and contributing ~45% of Group revenue and ~95% of operating profit. EBITDA and operating profit rose by low‑to‑mid teens, supported by Netstar’s subscriber base surpassing two million and Altron FinTech’s SME expansion. IT Services showed a turnaround, with Digital Business returning to profitability. Distribution (Arrow) recorded its first positive book‑to‑bill ratio in two years. Strategic highlights included enhanced B‑BBEE ownership credentials (63% Black Owned, 35% Black Women Owned). Outlook points to stronger performance in H2 FY27, driven by annuity‑based revenue streams and disciplined capital allocation.